Download
1 / 18
200 likes | 457 Vues
Chapter 8 Hypothesis Tests. What are Hypothesis Tests ? A set of methods and procedure to s tudy the reliability of claim s about population parameter s. Examples of Hypotheses :. The mean monthly cell phone bill of this city is $42.

E N D
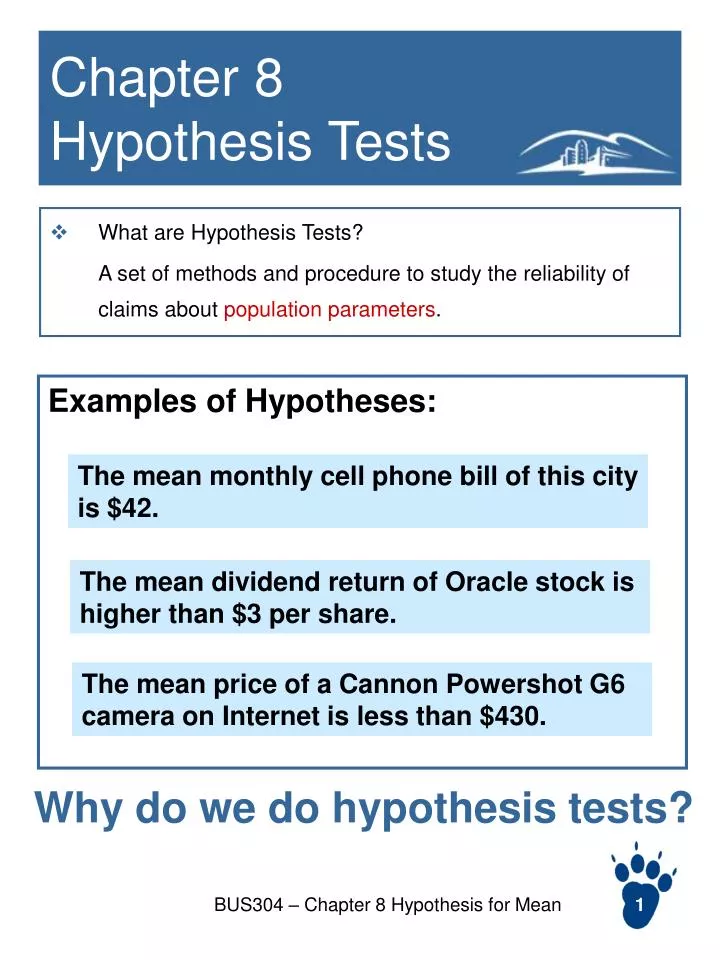
Chapter 8 Hypothesis Tests • What are Hypothesis Tests? A set of methods and procedure to study the reliability of claims about population parameters. Examples of Hypotheses: The mean monthly cell phone bill of this city is $42. The mean dividend return of Oracle stock is higher than $3 per share. The mean price of a Cannon Powershot G6 camera on Internet is less than $430. Why do we do hypothesis tests? BUS304 – Chapter 8 Hypothesis for Mean
Constructing a null hypothesis H0 • A null hypothesis is the basis for testing. • Null Hypothesis H0 • Mathematical statement of the assumption to be tested • Example: The average number of TV sets in U.S. Homes is at least three ( H0: ≥3 ) • The null hypothesis is always about the population parameter, not about a sample statistic • Conventionally, it always contains an equal sign. e.g. ≥4, ≤6, or =10 BUS304 – Chapter 8 Hypothesis for Mean
Alternative Hypothesis • The opposite of null hypothesis • Written as HA. • Example: • The mean price of a beach house in Carlsbad is at least $1million dollars • The mean gas price in CA is no higher than $3 per gallon • The mean weight of a football quarterback is $200lbs. H0: μ≥ $1million HA: μ < $1million H0: μ ≤ $3 per gallon HA: μ > $3 per gallon H0: μ= 200lbs HA: μ 200lbs BUS304 – Chapter 8 Hypothesis for Mean
Exercise • Problem 8.1 (Page323) BUS304 – Chapter 8 Hypothesis for Mean
Hypothesis Testing Process • We want to test whether the null hypothesis is true. • In statistics, we can never say a hypothesis is wrong for sure. • We can only evaluate the probability that the hypothesis is true • If the probability is too small, we say we reject the null hypothesis • Otherwise, we say we fail to reject the null hypothesis. sample Not likely. Reject the hypothesis The mean height of male students at Cal State San Marcos is 6 feet BUS304 – Chapter 8 Hypothesis for Mean
Types of errors • Type I error • Rejecting the null hypothesis when it is, in fact, true. • It may happen when you decide to reject the hypothesis. -- you decide to reject the hypothesis when your result suggests that the hypothesis is not likely to be true. However, there is a chance that it is true but you get a bad sample. • Type II error • Failing to reject the null hypothesis when it is, in fact, false. • It may happen when you decide not to reject. • Whatever your decision is, there is always a possibility that you make at least one mistake. • The issue is which type error is more serious and should not be made. BUS304 – Chapter 8 Hypothesis for Mean
Exercise • Problem 8.7 (Page 323) BUS304 – Chapter 8 Hypothesis for Mean
Two kinds of tests • One-tailed test: • Upper tail test (e.g. ≤ $1000) • Lower tail test (e.g. ≥$800) Reject when the sample mean is too high Reject when the sample mean is too low • Two-tailed test: • =$1000 Reject when the sample mean is either too high or too low BUS304 – Chapter 8 Hypothesis for Mean
Information needed in hypothesis tests • When is known • The claimed range of mean (i.e. H0 and HA) • When to reject: level of significance • i.e. if the probability is too small (even smaller than ), I reject the hypothesis. • Sample size n • Sample mean • When is unknown • The claimed range of mean (i.e. H0 and HA) • When to reject: level of significance • i.e. if the probability is too small (even smaller than ), I reject the hypothesis. • Sample size n • Sample mean • Sample variance (or standard deviation): s2 or s BUS304 – Chapter 8 Hypothesis for Mean
Upper tail test • The cutoff z-score. z • The corresponding z-score which makes P(z> z)= • In other words, P(0<z< z) = 0.5 - H0: μ≤ 3 HA: μ > 3 Reject when the sample mean is too high z • Level of Significance: • Generally given in the task • The maximum allowed probability of type I error • In other words, the size of the blue area • Decision rule • If zx > z, reject H0 • If zx≤z, do not reject H0 BUS304 – Chapter 8 Hypothesis for Mean
Example • Problem 8.3 (P323) BUS304 – Chapter 8 Hypothesis for Mean
An alternative way to test: use p-value • p-value: • The probability of getting the sample mean or higher. • Reject if the p-value is too small • i.e. even smaller than • It is too insignificant. • Exercise: • Use the p-value method to test the hypotheses in Problem 8.3 • Think: what is the probability of making type 1 and type 2 errors • if you reject the hypothesis • If you fail to reject the hypothesis H0: μ≤ 3 HA: μ > 3 The p-value of the sample mean BUS304 – Chapter 8 Hypothesis for Mean
More Exercise • Problem 8.4 BUS304 – Chapter 8 Hypothesis for Mean
H0: μ≥ 3 HA: μ < 3 Reject when the sample mean is too low Lower tail test • The cutoff z score is negative • z <0 • Decision rule: • If zx < z, reject H0 • If zx≥z, do not reject H0 • The hypothesis is rejected only when you get a sample mean too low to support it. • Exercise: Problem 8.5 (Page 323) assuming that =210 BUS304 – Chapter 8 Hypothesis for Mean
H0: μ= 3 HA: μ 3 /2 /2 Two-tailed tests • The null hypothesis is rejected when the sample mean is too high or too low • Given a required level of significance • There are two cutoffs. (symmetric) • The sum of the two blue areas is . • So each blue area has the size /2. • The z-scores: BUS304 – Chapter 8 Hypothesis for Mean
H0: μ= 3 HA: μ 3 /2 /2 Decision Rule for two-tailed tests • Decision rule for two-tailed tests • If zx > z/2, reject H0 • Or, if zx < -z/2, reject H0 • Otherwise, do not reject H0 Exercise 8.8 BUS304 – Chapter 8 Hypothesis for Mean
When is unknown • Now we use the sample standard deviation (i.e. s) to estimate the population standard deviation • The distribution is a t-distribution, Not Normal ! You should check the t-table P597 Pay attention to the degree of freedom: n-1 • The rest of the calculations are the same. Exercise 8.5 – lower tail test Exercise 8.14 – upper tail test Exercise 8.16 – two-tailed test BUS304 – Chapter 8 Hypothesis for Mean
Summary of Hypothesis testing Steps • Step 1: Construct the hypotheses pair H0 and HA. • Step 2: Whether is given? • Given: use z-score (page 595) • Unknown: use t-score (page 597) • Need to have s (sample standard deviation) • Degree of freedom: n-1 • Step 3: Determine the decision rule • One-tailed? Upper or lower? • Two-tailed? • Write down the decision rule based on the type of tests. • Step 5: Find out the cutoff z-score or t-score ( ) Drawing always help! • Step 6: Find out the z-score or t-score for sample mean ( ) • Step 7: compare and make the right decision. BUS304 – Chapter 8 Hypothesis for Mean