Download
1 / 15
150 likes | 153 Vues
This presentation outlines the smart specialization process and the priorities for CBE development in Lithuania and Azerbaijan. It discusses the strategic roadmaps, consultation with national expert institutions, and the implementation plans for each priority. The presentation also highlights the importance of competency-based education and its impact on the economy.

E N D
Selectionofpriority sectors for CBE development Gintautas JakštasBaku, 2018 July
PRESENTATION OUTLINE • Smart specialization • What is Smart specialisation? • The process: From analysis to implementation • Priorities in Lithuania • Azerbaijan strategic road map • Competency-basedEducation
The process: From analysis to implementation 6 broad Priority fields 1 Priority field Analysis of challenges, research potential and structure of economy 2 20 Priorities within 6 broad Priority fields Priorities In-depth analysis in every Priority field + expert panels 3 For every Priority (total 20 roadmaps) Roadmaps Expert panels + broad survey Developed according to roadmaps (total 20 plans) Priority implementation plans 4 Consultation with National expert institutions + implementing ministries
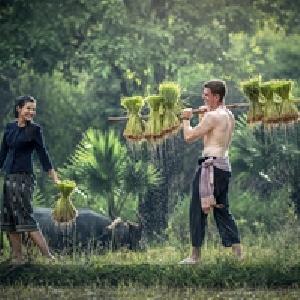
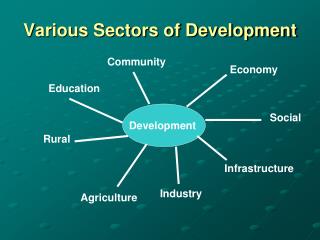
Priorities in Lithuania • Agro-innovationand food technologies • Safer food and sustainable usage of biomaterials • Functional food • Innovative development, improvement and processing of biological raw materials (biorefinery) • Energy and sustainable environment • Smart systems for energy efficiency, diagnostic, monitoring, metering and management of generators, grids and customers • Energy and fuel production using biomass/waste and waste treatment, storage and disposal • Technology for the development and use of smart low-energy buildings – digital construction • Solar energy installations and technologies for using them for the power generation , heating and cooling • Health technologies and biotechnology • Molecular technologies for medicine and biopharmaceutics • Advanced applied technologies for individual and public health • Advanced medical engineering for early diagnostics and treatment • Inclusive and creativesociety • Modern self-development technologies and processes promoting formation of creative and productive individuals • Technologies and processes for the development and implementation of breakthrough innovations • Novel production processes, materials and technologies • Photonic and laser technologies • Functional materials and coatings • Structural and composite materials • Flexible technological systems for product development and fabrication • Transport, logistics and information and communication technologies • Advanced electronic content, content development technologies and information interoperability • ICT infrastructure, cloud computing solutions and services • Smart transport systems and ICT • Technologies/models for the international transport corridors’ management and integration of modes of transport
Azerbaijanstrategicroadmap • In late 2016, the President approved a strategic roadmap for economic reforms that identified key non-energy segments of the economy for development, such as agriculture, logistics, information technology, and tourism. • 12 Strategic Roadmaps Endorsed in Azerbaijan aim to define the country`s development goals and priorities and ensure their implementation • Well developed methodology: • Primaryobjectives • Analysis of current situation • Global trends • Potential • Primary market opportunities • SWOT analysis of sector • Strategic vision • 2020 • Long term vision for 2025 • Target Indicators, Strategic Objectives and Targets, Financial Mechanism • Implementation, Monitoring and Evaluation
STRATEGIC ROAD MAP FOR DEVELOPMENT OFSECTORS IN THE REPUBLICOF AZERBAIJAN • Tourism SWOT analysis, weaknesses: • Training of skilled workers does not meet labor market requirements both from quality and quantity perspectives; • Relatively less foreign language speakers in regions. • Agricultural products SWOT analysis weaknesses: • low fertility indices as a result of narrow dissemination of the implementation practice of advanced farming methods, great role of extensive factors in growth of production of most products. • inadequate knowledge and skills of farmers in relevant fields to carry out activities with advanced methods; • SWOT analysis of logistics and trade sector, weaknesses: • small potential for qualified personnel in logistics; • low labor productivity.
ELEMENTS OF QUALITY FOR COMPETENCY-BASED EDUCATION by Competency-based Education Network
Economy sectors: Employment and GDP • InAgriculturesector work 37 percent workers and generate 6 percent of GDP • In Services work 49 percent workers and generate 42 percent of GDP • In industry work only 14 percent of workers and this sector generates 52 percent of GDP Inner Circle - Share of economic sectors in the GDP, 2016 Outer Circe - Distribution of employment by economic sector, 2016 • Manufacture of tobacco products 2010: 0,6% pop – 0,08% GDP, 2016: 0,3% pop – 0,14% GDP • Metallurgy industry 2010: 8,3% pop – 0,5% GDP, 2016: 3,9% pop – 1% GDP • Manufacture of food products 2010: 15,1% pop – 1,5% GDP, 2016: 18,8% pop – 4,3% GDP • Manufacture of rubber and plastics products 2010: 4% pop – 0,2% GDP, 2016: 5,5% pop – 0,6% GDP
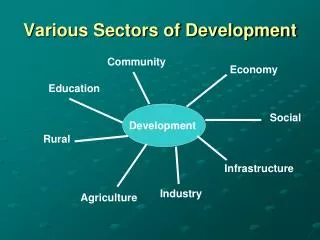
Selection of priority sectors for the development of competence-based education standards