Download

1 / 8
80 likes | 84 Vues
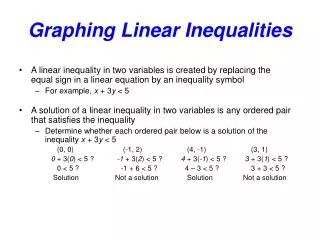
Learn how to graph quadratic inequalities of 2 variables using different methods. Understand how to shade regions and determine the solution by analyzing the graph.

E N D
Graphing Inequalities Accelerated Geometry B/Algebra II A
Quadratic Inequalities of 2 Variablesy > ax2 + bx + c or y > ax2 + bx + c • When graphing quadratic inequalities of 2 variables, first graph the quadratic function – • If the inequality has an “equal to” line under it, graph the function as is, but • If the inequality doesn’t have an “equal to” line under it, just sketch the function with a dotted line. • Then, since you want to graph all the points in which the y value is higher than the points on the graph, shade ABOVE the curve. Y > x2 – x - 6
Quadratic Inequalities of 2 Variablesy < ax2 + bx + c or y <ax2 + bx + c • When graphing quadratic inequalities of 2 variables, first graph the quadratic function – • If the inequality has an “equal to” line under it, graph the function as is, but • If the inequality doesn’t have an “equal to” line under it, just sketch the function with a dotted line. • Then, since you want to graph all the points in which the y value is lower than the points on the graph, shade BELOW the curve. y < 4x2 – 3x - 2
Graphing One-Variable Inequalitiesax2+ bx + c > 0 or ax2+ bx + c > 0 Way #1 – Use the number line • When graphing quadratic inequalities of 1 variable, first get the expression on one side of the inequality and 0 on the other. • Now factor the expression and find its roots. (In other words, find the values of x that make the expression equal 0.) • Plot those roots on the number line and write the factors to the side – but above the line. • Determine whether each factor will be positive or negative when numbers on the number line are substituted into the expression. • Remembering that factors are multiplied together to get the original expression, decide if the product will be positive or negative. • Shade the region corresponding to the positive product. • Write that region as an inequality. Solve x2 + 12 > 7x x2 – 7x + 12 > 0 (x – 3)(x – 4) > 0 x – 3 - - - - 0 + + + + + + + + x – 4 - - - - - - - - - -0 + + + + (x-3)(x-4) + + 3 - - - - 4 + + + so x > 4 or x < 3
Graphing One-Variable Inequalitiesax2+ bx + c > 0 or ax2+ bx + c > 0 Way #2 – Use the function graph • When graphing quadratic inequalities of 1 variable, first get the expression on one side of the inequality and 0 on the other. • Now factor the expression and find its roots. (In other words, find the values of x that make the expression equal 0.) • Let the expression equal y and graph the function. • Determine where the y values on the graph are greater than 0. (In other words, where does the graph lie above the x axis?) The x values that correspond to this part of the graph is your solution. Solve x2 + 12 > 7x x2 – 7x + 12 > 0 (x – 3)(x – 4) > 0 Consider the graph of f(x) = (x – 3)(x – 4) 3 4 The graph is above the x axis to the left of 3 and to the right of 4, so x > 4 or x < 3
Graphing One-Variable Inequalitiesax2+ bx + c < 0 or ax2+ bx + c < 0 Way #1 – Use the number line • When graphing quadratic inequalities of 1 variable, first get the expression on one side of the inequality and 0 on the other. • Now factor the expression and find its roots. (In other words, find the values of x that make the expression equal 0.) • Plot those roots on the number line and write the factors to the side – but above the line. • Determine whether each factor will be positive or negative when numbers on the number line are substituted into the expression. • Remembering that factors are multiplied together to get the original expression, decide if the product will be positive or negative. • Shade the region corresponding to the negative product. • Write that region as an inequality. Solve x2 + 12 > 7x x2 – 7x + 12 > 0 (x – 3)(x – 4) > 0 x – 3 - - - - 0 + + + + + + + + x – 4 - - - - - - - - - -0 + + + + (x-3)(x-4) + + 3 - - - - 4 + + + so 3 < x < 4
Graphing One-Variable Inequalitiesax2+ bx + c < 0 or ax2+ bx + c < 0 Way #2 – Use the function graph • When graphing quadratic inequalities of 1 variable, first get the expression on one side of the inequality and 0 on the other. • Now factor the expression and find its roots. (In other words, find the values of x that make the expression equal 0.) • Let the expression equal y and graph the function. • Determine where the y values on the graph are less than 0. (In other words, where does the graph lie below the x axis?) The x values that correspond to this part of the graph is your solution. Solve x2 + 12 < 7x x2 – 7x + 12 < 0 (x – 3)(x – 4) < 0 Consider the graph of f(x) = (x – 3)(x – 4) 3 4 The graph is below the x axis between 3 and 4, 3 > x > 4
Other Resources! http://www.purplemath.com/modules/ineqquad.htm http://www.mathwarehouse.com/quadratic-inequality/how-to-solve-and-graph-quadratic-inequality.php http://www.mathsisfun.com/algebra/inequality-quadratic-solving.html https://www.khanacademy.org/math/algebra2/polynomial-and-rational/quad_ineq/v/quadratic-inequalities?_escaped_fragment_=