Download
1 / 17
170 likes | 249 Vues
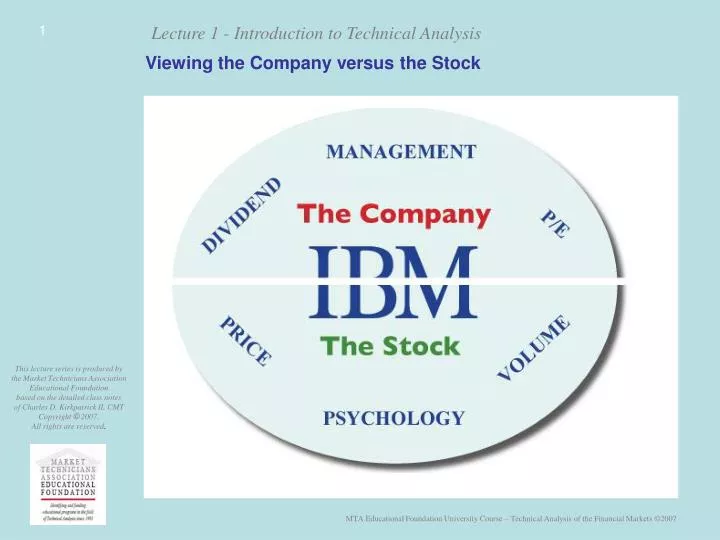
Viewing the Company versus the Stock. Support and Resistance. Walt Disney - Daily O,H,L,C. Walt Disney - Daily. Resistance. Support. StockCharts.com. Merck & Co. - Daily H,L,C. Merck - Daily. Wide gap down on negative news. StockCharts.com. S&P 500 Stock Index - Monthly H,L,C.

E N D
Walt Disney - Daily O,H,L,C Walt Disney - Daily Resistance Support StockCharts.com
Merck & Co. - Daily H,L,C Merck - Daily Wide gap down on negative news StockCharts.com
S&P 500 Stock Index - Monthly H,L,C S&P 500 - Monthly Secular bull market
S&P 500 Stock Index - Weekly H,L,C S&P 500 - Weekly Cyclical bull market Cyclical bear market StockCharts.com
NASDAQ 100 Index - Weekly H,L,C NASDAQ - Weekly Secondary trend StockCharts.com
Dow Jones Industrial Average 1896 and present May 26, 1896 Original Dow Jones Industrial Average American Cotton Oil American Sugar American Tobacco Chicago Gas Distilling & Cattle Feeding General Electric Laclede Gas National Lead North American Company Tennessee Coal & Iron U.S. Leather pfd. U.S. Rubber Current Dow Jones Industrial Average 3M Alcoa Altria Group American Express AT&T Boeing Caterpillar Citigroup Coca-Cola DuPont Exxon Mobil General Electric General Motors Hewlett-Packard Home Depot Honeywell Intel IBM Johnson & Johnson JPMorgan Chase Kraft Foods McDonald’s Merck Microsoft Pfizer Procter & Gamble United Technologies Verizon Communications Wal-Mart Walt Disney Kirkpatrick & Dahlquist Chart 3.2
Dow Theory and the Ideal Marketplace Top Kirkpatrick & Dahlquist Chart 6.1 Uptrend Downtrend Bottom
Dow Theory Three Trend Types May 2002 - May 2005 DJ Industrials - Weekly A Minor Trends B Secondary Downtrend (A-B) Kirkpatrick & Dahlquist Chart 6.2 Primary Uptrend StockCharts.com
Dow Theory of “Confirmation” DJIA and DJTA - Weekly - May 2002-May 2005 DJ Industrials - Weekly Confirmation of New High in Transports Kirkpatrick & Dahlquist Chart 6.3 DJ Transports - Weekly New High StockCharts.com
Confirmation Between S&P 500 and Russell 2000 Weekly - May 2002 - September 2005 S&P 500 - Weekly New High Kirkpatrick & Dahlquist Chart 6.4 Beginning of Primary Uptrend (Large Cap versus Small Cap) Russell 2000 - Weekly New High StockCharts.com
Volume Confirmation August 2004 - May 2005 - Weekly S&P 500 - Weekly Declining Price Rising Price Kirkpatrick & Dahlquist Chart 6.5 (Bearish) (Bearish) Rising Price (Bullish) Declining Volume Rising Volume Rising Volume StockCharts.com
The Trend Uptrend Downtrend Lower Peaks Higher Peaks Higher Troughs Lower Troughs Kirkpatrick & Dahlquist Chart 2.1 Sideways Trend Horizontal Peaks Horizontal Troughs
Dow Jones Industrial Average and Dow Jones Transportation Average - Weekly H,L,C DJ Industrials - Weekly Declining bottoms Rising bottoms DJ Transports - Weekly Rising bottoms Declining bottoms StockCharts.com
Trend Lines from Top to Top and Bottom to Bottom CNET - Weekly Kirkpatrick & Dahlquist Chart 2.2 StockCharts.com
Daily and Hourly CNET Networks CNET - Daily Kirkpatrick & Dahlquist Chart 2.4