Download
1 / 1
10 likes | 327 Vues
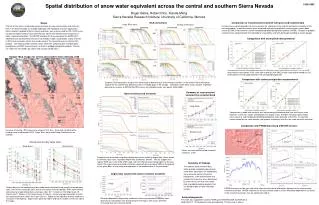
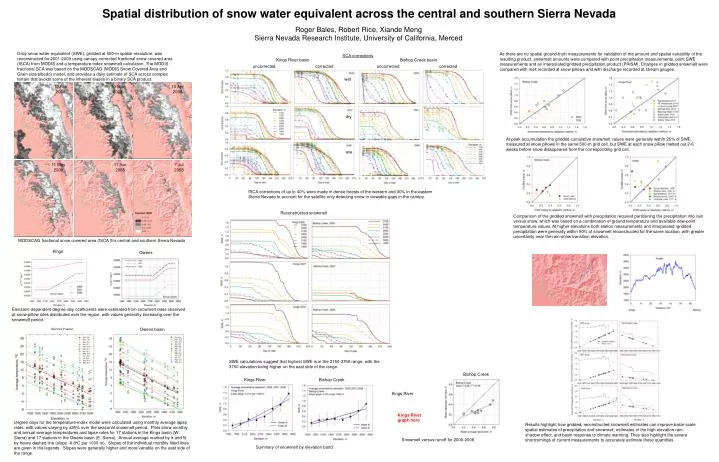
Spatial distribution of snow water equivalent across the central and southern Sierra Nevada. Roger Bales, Robert Rice, Xiande Meng Sierra Nevada Research Institute, University of California, Merced.

E N D
Spatial distribution of snow water equivalent across the central and southern Sierra Nevada Roger Bales, Robert Rice, Xiande Meng Sierra Nevada Research Institute, University of California, Merced Daily snow water equivalent (SWE), gridded at 500-m spatial resolution, was reconstructed for 2001-2009 using canopy-corrected fractional snow covered area (fSCA) from MODIS and a temperature-index snowmelt calculation. The MODIS fractional SCA was based on the MODSCAG (MODIS Snow Covered Area and Grain size/albedo) model, and provides a daily estimate of SCA across complex terrain that avoids some of the inherent biases in a binary SCA product. As there are no spatial ground-truth measurements for validation of the amount and spatial variability of the resulting product, snowmelt amounts were compared with point precipitation measurements, point SWE measurements and an interpolated/gridded precipitation product (PRISM). Changes in gridded snowmelt were compared with melt recorded at snow pillows and with discharge recorded at stream gauges. SCA corrections Kings River basin Bishop Creek basin uncorrected corrected uncorrected corrected wet 12 Feb 2008 10 Mar 2008 10 Apr 2008 dry At peak accumulation the gridded cumulative snowmelt values were generally within 25% of SWE measured at snow pillows in the same 500-m grid cell, but SWE at each snow pillow melted out 2-6 weeks before snow disappeared from the corresponding grid cell. ave 11 May 2008 11 Jun 2008 7Jul 2008 fSCA corrections of up to 40% were made in dense forests of the western and 30% in the eastern Sierra Nevada to account for the satellite only detecting snow in viewable gaps in the canopy. Reconstructed snowmelt Comparison of the gridded snowmelt with precipitation required partitioning the precipitation into rain versus snow, which was based on a combination of ground temperature and available dew-point temperature values. At higher elevations both station measurements and interpolated /gridded precipitation were generally within 50% of snowmelt reconstructed for the same location, with greater uncertainty near the rain-snow transition elevation. MODSCAG fractional snow covered area (fSCA )for central and southern Sierra Nevada Kings Owens Elevation-dependent degree-day coefficients were estimated from snowmelt rates observed at snow-pillow sites distributed over the region, with values generally increasing over the snowmelt period. Kings basin Owens basin Bishop Creek SWE calculations suggest that highest SWE is in the 3150-3750 range, with the 3750 elevation being higher on the east side of the range. Kings River Kings River Bishop Creek Kings River graph here Snowmelt versus runoff for 2000-2008 Degree days for the temperature-index model were calculated using monthly average lapse rates, with values varying by ±25% over the seasonal snowmelt period. Plots show monthly and annual average temperatures and lapse rates for 17 stations in the Kings basin (W. Sierra) and 17 stations in the Owens basin (E. Sierra). Annual average marked by × and fit by heavy dashed line (slope -6.8oC per 1000 m). Slopes of the individual monthly fitted lines are given in the legends. Slopes were generally higher and more variable on the east side of the range. Results highlight how gridded, reconstructed snowmelt estimates can improve basin-scale spatial estimates of precipitation and snowmelt, estimates of the high-elevation rain-shadow effect, and basin response to climate warming. They also highlight the severe shortcomings of current measurements to accurately estimate these quantities. Summary of snowmelt by elevation band