Download
1 / 28
290 likes | 444 Vues
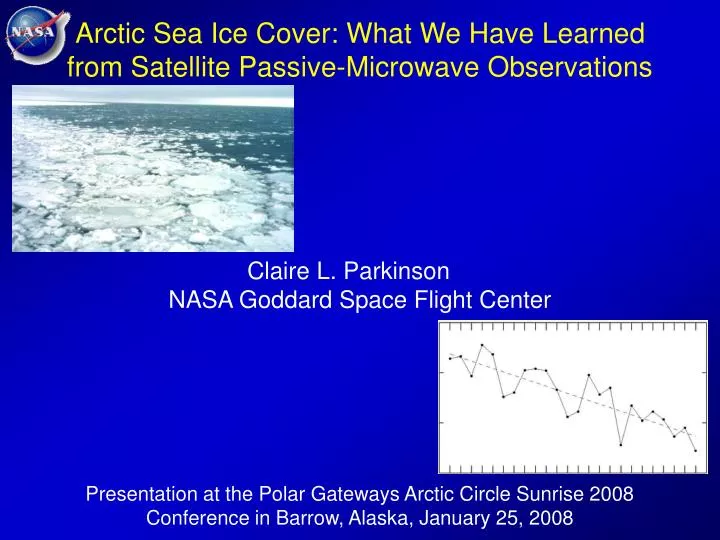
Arctic Sea Ice Cover: What We Have Learned from Satellite Passive-Microwave Observations Claire L. Parkinson NASA Goddard Space Flight Center Presentation at the Polar Gateways Arctic Circle Sunrise 2008 Conference in Barrow, Alaska, January 25, 2008.

E N D
Arctic Sea Ice Cover: What We Have Learned from Satellite Passive-Microwave Observations Claire L. Parkinson NASA Goddard Space Flight Center Presentation at the Polar Gateways Arctic Circle Sunrise 2008 Conference in Barrow, Alaska, January 25, 2008
Global Surface Temperatures over the Last 150 Years (Courtesy Jim Hansen)
Animation of 2003 Arctic Sea Ice Coverage, from satellite data White: Highly compact ice. Shades of light blue: Ice of lesser compactness. (Daily images)
Selected Impacts of Sea Ice Insulation Reflection of solar radiation Hindrance to ships Many impacts on polar life
A Key Positive Feedback Involving Sea Ice Warming Sea ice retreat Increased absorption of solar radiation Reduced surface albedo
Sea Ice from Satellite Visible Imageryand Its Limitations Landsat image of sea ice in the Weddell Sea, November 17, 1973. Landsat image of sea ice and clouds in the Arctic, September 5, 1972.
Satellite Detection of Sea Ice Using Microwave Radiation: Ice/Water Emissivity Contrast
Sample Satellite Passive-Microwave Brightness Temper-ature Images forMarch 1, 1999, from data from the Special Sensor Microwave Imager (SSMI)
Arctic Sea Ice Concentrations, March 1, 1999 Derived from Satellite Passive-Microwave Data The values mapped are sea ice concentrations (percent areal coverages of ice).
Key Satellite Passive-Microwave Instruments • NASA Nimbus 5 Electrically Scanning Microwave Radiometer (EMSR), launched December 1972. • NASA Nimbus 7 Scanning Multichannel Microwave Radiometer (SMMR), launched October 1978. • DMSP Special Sensor Microwave Imager (SSMI), first launched June 1987. • Japan Aerospace Exploration Agency (JAXA) Advanced Microwave Scanning Radiometer for the Earth Observing System (AMSR-E) on NASA’s Aqua spacecraft, launched May 2002. (Arctic sea ice, March 1, 2003, from Aqua AMSR-E data; image from T. Markus)
Winter and Summer Arctic Sea Ice Coverages Derived from Satellite Passive-Microwave Data The values mapped are sea ice concentrations (percent areal coverages of ice).
Monthly Arctic Sea Ice ExtentsNovember 1978 – December 2006 (from Parkinson and Cavalieri, 2008)
Monthly Arctic Sea Ice Extent DeviationsNovember 1978 – December 2005 (extended from Parkinson, Cavalieri, Gloersen, Zwally, and Comiso, 1999)
Arctic September Sea Ice Concentra-tions, 1979-2003, illustrating interannual variability (from SMMR and SSMI data)
Length of the Northern Hemisphere Sea Ice Season, 2004 (updated from Parkinson 2000a)
Trends in the Length of the Sea Ice Season1979 - 1986 (recolored from Parkinson 1992)
September 14, 2007 Arctic Sea Ice Distribution vs. Minima in 2005 and Averaged over 1979-2006 (from Comiso, Parkinson, Gersten, and Stock, 2008)
Satellite-Derived Reduction in Arctic Sea Ice Coverage since November 1978 • Decreases in the areal coverage of the ice • Marked decreases in all seasons • Marked decreases in most regions (with none of the regions having overall increases) • Decreases in the length of the sea ice season
Sample Consequence: Polar Bear Impact in Western Hudson Bay (Robert Taylor) • Earlier ice breakup, forcing earlier polar bear retreat to land. • Average weight of adult female polar bears in Western Hudson Bay: 295 kg in 1980, 230 kg in 2004. • Western Hudson Bay polar bear population: about 1,200 in 1989, about 950 in 2004. Sea ice coverage on April 29, 2006 (left) and November 14, 2005 (right), from Aqua’s AMSR-E satellite data Date when ice concentration in western Hudson Bay first reaches ≤ 50%, from Stirling and Parkinson (2006).
Thinning of the Arctic Sea Ice Coveras determined by Rothrock, Yu, and Maykut from submarine data Mean ice draft: 1958-1976 – 3.1 m 1993-1997 – 1.8 m Thinning: 1.3 m, or 40% (later adjusted down). Small dots are the original data points; triangles and squares have been seasonally adjusted to September 15. (from Rothrock et al. 1999)
Laser Altimetry from the Ice, Cloud, and Land Elevation Satellite (ICESat) (schematic from the ICESat Science Team)
Broader Context • Impacts of the Ice Decreases • Helpful to shipping and to some marine life • Harmful to polar bears, some seal species, walruses, Arctic foxes, and other wildlife dependent on the ice • Enhances warming, through feedbacks • Other Arctic Changes • Rising temperatures • Declining snow cover • Thawing permafrost • Diminishing lake and river ice • Melting glaciers • Melting Greenland Ice Sheet • Antarctic Sea Ice Changes • Major decreases in the 1970s • Increases overall since 1978 • Good regional ice/temperature correspondence July 24, 1909 August 13, 2004 Retreat of Alaska’s Holgate Glacier (photos courtesy Jim Tucker)
Southern Ocean Sea Ice Decreases in the 1970s Area (106 km2) 1973 1974 1975 1976 1977 1978 1979 12-month running mean of sea ice area (bottom curve) and of ocean area with ice concentrations exceeding 1 octa (top curve) and 4 octas (middle curve). (Figure from Kukla and Gavin 1981.)
30-Year Record of Southern Ocean Sea Ice Extents, 1973-2002 (from Cavalieri, Parkinson, and Vinnikov 2003)
Summary • Arctic sea ice over the past 3 decades: clear overall decreases in every month, although with considerable interannual and regional variability. • Multiple impacts of the ice decreases: climate feedbacks, impacts on wildlife and human activities. • Contrast with Antarctic sea ice, which has increased overall since 1978. • Likely future: continued ice decreases in the Arctic, eventual ice decreases in the Antarctic. • Uncertainties: scientists do not fully understand the observed changes, making future surprises likely. Seas of Okhotsk and Japan