Download
1 / 31
310 likes | 513 Vues
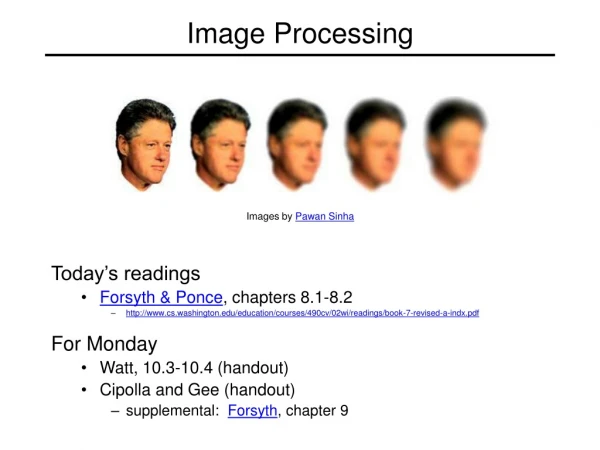
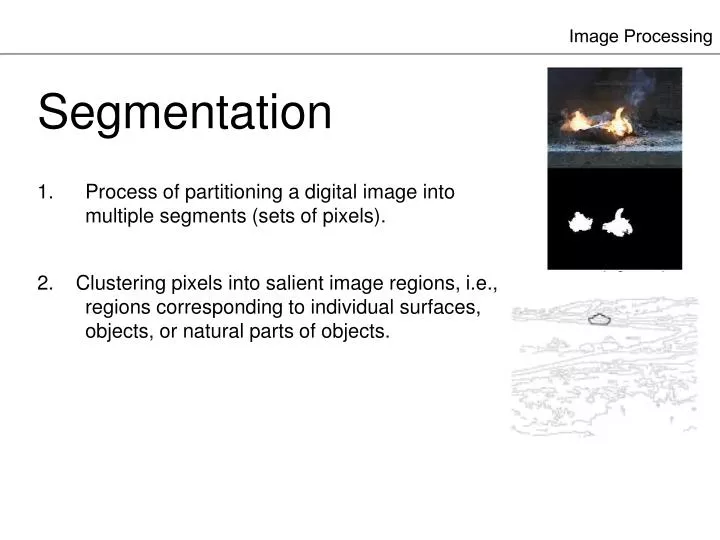
Image Processing. Segmentation Process of partitioning a digital image into multiple segments (sets of pixels). 2. Clustering pixels into salient image regions, i.e., regions corresponding to individual surfaces, objects, or natural parts of objects. Image Processing. Segmentation

E N D
Image Processing Segmentation Process of partitioning a digital image into multiple segments (sets of pixels). 2. Clustering pixels into salient image regions, i.e., regions corresponding to individual surfaces, objects, or natural parts of objects.
Image Processing Segmentation Used to locate objects and boundaries (lines, curves, etc.) in images. Process of assigning a label to every pixel in an image such that pixels with the same label share certain visual characteristics.
Image Processing Segmentation Two of the most common techniques: thresholding and edgefinding
Image Processing Segmentation Two of the most common techniques: edgefinding thresholding
Image Processing The original image: The objects in image: A parameter called the brightnessthreshold is chosen and applied to the image f(x, y) as follows: (x, y) Object f(x, y) or (x, y) Object f(x, y) A. Threshold
Image Processing The original image: The objects in image: Remark: The output is the label "object" or "background" which, due to its dichotomous nature, can be represented as a Boolean variable "1" or "0". A. Threshold
Image Processing The original image: The objects in image: How to choose the threshold ? A. Threshold
Image Processing A threshold will be chosen independently of the image data Fixed threshold
Image Processing Fixed threshold Source and segmented images with fixed threshold 128
Ảnh I: Ảnh I đã được phân đoạn với ngưỡng 200 cho thành phần RED: R = 200 Image Processing
Ảnh I: Ảnh I đã được phân đoạn với ngưỡng 170: R = 170 Image Processing
Isodata algorithm • This iterative technique for choosing a threshold was developed by Ridler and Calvard . • Set k = 0, 0 = L/2. • While |k-k-1|> • 1. Compute the sample mean mf,k of the gray values associated with the foreground pixels and the sample mean mb,k of the gray values associated with the background. • 2. Compute a new threshold value k: • k = ( mf,k-1 + mb,k-1 ) / 2 • 3. k = k +1
Isodata algorithm The threshold chosen by Isodata algorithm is 139
Ảnh I: Isodata algorithm Ảnh I đã được phân đoạn với ngưỡng 134: = 134, k=2
Ảnh I: Isodata algorithm Ảnh I đã được phân đoạn với ngưỡng 128: • = 128, k=1
Ảnh I: Isodata algorithm Ảnh I đã được phân đoạn với ngưỡng 116: = 116, k=4
m1 = 0; m2 = L; teta = (m1 + m2) / 2 stop = false while !stop ts1 = 0; ts2 = 0 ms1 = 0; ms2 = 0 for i = 0 to teta ts1 = ts1 + h(i) * i ms1 = ms1 + h(i) m1 = ts1/ms1 for i = teta to L ts2 = ts2 + h(i) * i ms2 = ms2 + h(i) m2 = ts2/ms2 tg = Round((m1 + m2) / 2) if teta - tg < stop = true teta = tg loop Isodata algorithm = 116, k=4
Image Processing Triangle algorithm A line is constructed between the maximum of the histogram at brightness bmax and the lowest value bmin = (p=0)% in the image.
Image Processing Triangle algorithm The distance d between the line and the histogram h[b] is computed for all values of b from b = bmin to b = bmax.
Image Processing Triangle algorithm The brightness value bo where the distance between h[bo] and the line is maximal is the threshold value, that is, = bo.
Image Processing Triangle algorithm Source and segmented images with threshold 152 chosen by triangle algorithm
dominant peak (183) Image Processing Background-symmetry algorithm Assumes a distinct and dominant peak for the background that is symmetric about its maximum.
Image Processing Background-symmetry algorithm • The maximum peak (maxp) is found by searching for the maximum value in the histogram. • Searching on the non-object pixel side of that maximum to find a p% point.
Image Processing Background-symmetry algorithm the object pixels are located to the left of the background peak at brightness 183, that mean h(183) = max {h(a): 0 h(a) 255 } = 351 search on the right of that peak to locate to find 95%. The total number of pixels in the image is 17424 and the total number of pixels on the right of peak is 8241, about 95% (94.59%) of 17424/2 = 8712.
Image Processing Background-symmetry algorithm At which brightness value 5% of the pixels lie to the right (are above)? This occurs at brightness 216. The number of pixels on the right of 216 is 936, equal to 5% (0.0537) the total number of pixels in the image: 17424. Because of the assumed symmetry, we use as a threshold a displacement to the left of the maximum that is equal to the displacement to the right where the p% is found.
Image Processing Background-symmetry algorithm This means a threshold value given by = 183 - (216 - 183) = 150. In formula:
Image Processing Background-symmetry algorithm Source and segmented images with fixed threshold 150
Một vài ứng dụng Bài toán: Input: Ảnh I Output: Ảnh I có chứa đám lửa?
Một vài ứng dụng • Lời giải: • Phân vùng ảnh I thành 2 phần: Phần 1 gồm những điểm ảnh thuộc đám lửa và phần 2 gồm những điểm ảnh không thuộc đám lửa. • 2. Nếu diện tích phần 1 lớn hơn một ngưỡng nào đó (ví dụ, có ít nhất vài điểm ảnh) thì kết luận là ảnh I có chứa đám lửa.
=170 (b) Một vài ứng dụng Đặc trưng màu điểm ảnh thuộc phần 1 (đám lửa)(1): (1) Đào Thanh Tĩnh, Hà Đại Dương, Một mô hình phát hiện đám cháy qua ảnh video, Tạp chí Khoa học và Kỹ thuật, ISSN-1859-0209, tr. 5-11, Số 127, 4-2009.
Ảnh I: Một vài ứng dụng Ảnh I đã được phân đoạn với ngưỡng 200 cho thành phần RED: