Download
1 / 37
370 likes | 617 Vues
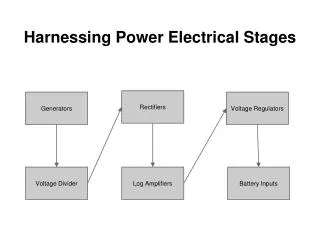
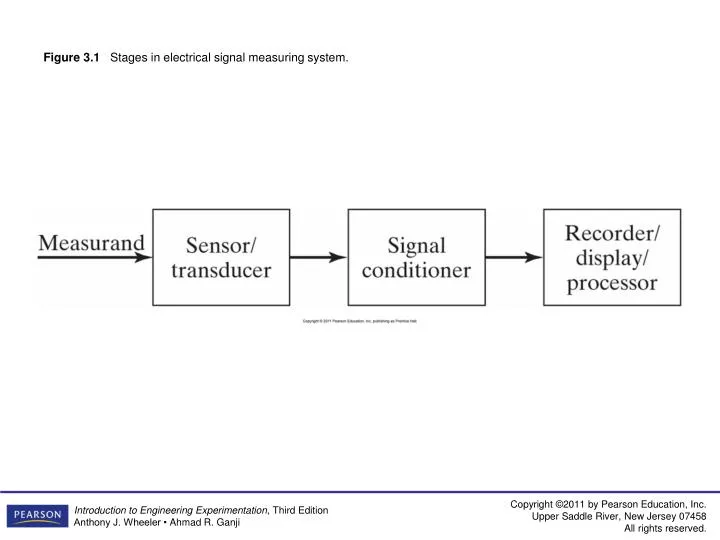
Figure 3.1 Stages in electrical signal measuring system. Figure 3.2 Generic voltage amplifier. Figure 3.3 Amplifier frequency response. Figure 3.4 Frequency distortion of a square wave due to high-frequency attenuation. Figure 3.5 Effect of phase angle on signal.

E N D
Figure 3.4 Frequency distortion of a square wave due to high-frequency attenuation.
Figure 3.7 Effect on signal of linear and nonlinear phase-angle variation with frequency: (a) original signal; (b) phase angle varies linearly with frequency; (c) phase angle varies nonlinearly with frequency.
Figure 3.8 Models for (a) source and (b) amplifier. (Based on Franco, 2002.)
Figure 3.9 Combined model of (a) input source, (b) amplifier, and (c) output load. (Based on Franco, 2002.)
Figure 3.10 Operational amplifier symbol and simplified model.
Figure 3.14 True differential input instrument amplifier. (From Franco, 2002.)
Figure 3.16 Categories of electrical filters: (a) lowpass; (b) highpass; (c) bandpass; (d) bandstop.
Figure 3.17 Gain of lowpass Butterworth filters as a function of order and frequency.
Figure 3.18 Gain of lowpass Chebyshev filters as a function of order and frequency.
Figure 3.19 Comparison of Butterworth and Bessel phase-angle variation with frequency.
Figure 3.20 Gain of lowpass Bessel filters as a function of order and frequency.
Figure 3.21 Lowpass Butterworth filter using op-amp: (a) op-amp circuit; (b) frequency response.
Figure 3.22 First-order Butterworth highpass filter using an op-amp: (a) op-amp circuit; (b) frequency response.
Figure 3.23 Bandpass filter using op-amp: (a) op-amp circuit; (b) frequency response.
Figure 3.24 Op-amp circuits for (a) integration and (b) differentiation.
Figure 3.25 Op-amp comparator: (a) circuit; (b) output voltage.
Figure 3.26 Digital multimeter with a digital voltmeter as a mode of operation. (Courtesy of Triplett Corp.)
Figure 3.27 Cathode ray oscilloscope. (Courtesy of Tektronix, Inc.)