Download
1 / 12
120 likes | 243 Vues
Introduction to the Normal Distribution (Dr. Monticino). Assignment Sheet Math 1680. Read Chapter 5 Assignment #5 Due Monday, Feb. 21 st Chapter 5 Set A: 1,2 Set B: 1,2,3,5 Set C: 1,2,3 Set D: 1,2,3,4,5 Set E: 1,2,3 Review exercises 1,2,3,4,7,8. Overview. Motivation

E N D
Assignment SheetMath 1680 • Read Chapter 5 • Assignment #5 • Due Monday, Feb. 21st • Chapter 5 • Set A: 1,2 • Set B: 1,2,3,5 • Set C: 1,2,3 • Set D: 1,2,3,4,5 • Set E: 1,2,3 • Review exercises 1,2,3,4,7,8
Overview • Motivation • Calculations
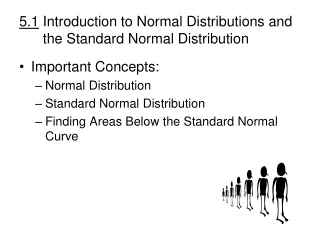
The Normal Distribution • Histograms for a variety of data often have a “bell curve” shape • Because of this empirical observation and theoretical results, often approximate the distribution of a population by a normal distribution • Recall area of bars in histogram give percentage in a group. • Similarly, the area under a specified portion of the normal distribution curve gives the percentage in that range
50% 50% same area The Normal Distribution • The standard normal curve is symmetric about 0 • 50% of the area is to the left of 0 and 50% to the right of 0 • Analogous areas on opposite sides of 0 have the same area
Standard Normal Distribution • 68% of the area is within [-1,1]; 95% between [-2,2]; and 99.7% between [-3,3] • Other values are given by a “normal table”
Converting to SD Units • Examples • Suppose that the average weight for U.S. men is 175 lbs. and the standard deviation for weight is 20 lbs. • If a man weighs 190 lbs., how many standard deviation units away from the mean weight is he? • A man is 3.2 standard deviations above the mean-weight. How heavy is he? • Ninety-five percent of U.S. men weigh between what two values?
Examples • Find area under normal curve • to the right of 1 • to the left of -.5 • to the left of .75 • between -1.5 and 1.5 • outside of -2 and 2
Examples • The birthweight for babies is approximately normally distributed with an average birthweight of 7.2 lbs. and a standard deviation of 1.1 lbs. • A newborn baby weighing 9 lbs is how many standard deviation units away from the mean weight? • What percent of newborns weigh between 8.3 and 6.1 lbs. • What percent of babies weigh more than 9 lbs? • At what percentile of weight is a 9 lb. baby? • What is the 25th percentile for newborns? • Thirty percent of babies weigh between what two values (centered on the mean)?
More Examples • Nationally, SAT scores are distributed normally with an average score of 1000 and a standard deviation of 150 • What percent of students taking the SAT score above 1400 • What percent score between 900 and 1200 • What is the 95th percentile of SAT scores (Dr. Monticino)