Download
1 / 107
1.07k likes | 1.17k Vues
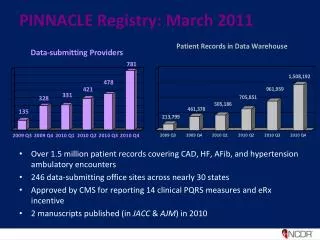
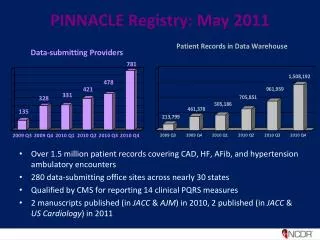
State Donor Registry Data Summary Q4 2011. April 19, 2012. Donor Designation Highlights – 2011. From 2010 to 2011, the number of designated donors increased 0.5% (7.1% year over year) to 101.4 million, equivalent to 42.7% of the U.S. adult population.

E N D
State Donor RegistryData SummaryQ4 2011 April 19, 2012
Donor Designation Highlights – 2011 • From 2010 to 2011, the number of designated donors increased 0.5% (7.1% year over year) to 101.4 million, equivalent to 42.7% of the U.S. adult population. • In the 50 states, DC and Puerto Rico, 36.2% of recovered organ donors, 41.8% of recovered tissue donors, and 44.7% of recovered eye donors were authorized by state donor registries • Donor designation rate increased from the prior quarter in 21 of 29 states reporting
Donor Designation in the United States 101,380,994 as of 12/31/11
Summary: Donor Designations, Q4 2011 • There are 101,380,994 designated donors nationwide • 23 states have signed up more than 2 million designated donors • The number of donor designations increased 0.5% since the previous quarter • The number of donor designations increased 7.1% over the last 12 months
Total Donor Designations, as of 12/31/11 *Estimated
Total Donor Designations, as of 12/31/11 *Estimated
Total Donor Designations, as of 12/31/11 *Estimated
Change in Total Donor Designations,Q3 2011 to Q4 2011 *Estimated
Change in Total Donor Designations,Q3 2011 to Q4 2011 *Estimated
Change in Total Donor Designations,Q3 2011 to Q4 2011 *Estimated
Change in Total Donor Designations,Q3 2011 to Q4 2011 *Estimated
Change in Total Donor Designations,Q3 2011 to Q4 2011 *Estimated; **Significant decrease due to data cleansing
Change in Total Donor Designations,12 Months Ending 12/31/11 *Estimated
Change in Total Donor Designations,12 Months Ending 12/31/11 *Estimated
Change in Total Donor Designations,12 Months Ending 12/31/11 *Estimated
Change in Total Donor Designations,12 Months Ending 12/31/11 *Estimated
Change in Total Donor Designations,12 Months Ending 12/31/11 *Estimated; **Significant decrease due to data cleansing
DD Share, Q4 2011, United States • 50 states and DC • Period ending 12/31/11 • DD Share: 42.7% U.S. Pop. Age 18+:237,657,645 As of 7/1/11
DD Share, 12/31/11 *Estimated **Source: US Census Bureau statistics, estimated as of 7/1/11
DD Share, 12/31/11 *Estimated **Source: US Census Bureau statistics, estimated as of 7/1/11
DD Share, 12/31/11 *Estimated **Source: US Census Bureau statistics, estimated as of 7/1/11
DD Share, 12/31/11 *Estimated **Source: US Census Bureau statistics, estimated as of 7/1/11
DD Share, 12/31/11 *Estimated **Source: US Census Bureau statistics, estimated as of 7/1/11
DD Share, Q4 2011 50%+ Nat’l 42.7%
DD Share, Q4 2011 50%+ Nat’l 42.7%
DD Share, Q4 2011 30-49% Nat’l 42.7%
DD Share, Q4 2011 30-49% <30% Nat’l 42.7%
Donor Designation Rate • Example: If a state issues 200,000 driver’s licenses and ID cards in a quarter, and 80,000 of these customers check ‘yes’ to be designated donors, the donor designation rate for the quarter is 40%
Summary: Donor Designation Rate, Q4 2011 • 34 states reported a cumulative donor designation rate of 39.9% (median 45.5%) in Q4 2011 • Donor designation rate increased over the previous quarter in 9 of 24 states reporting data for both quarters
Donor Designation Rate, Q4 2011 50%+ Median45.5%
Donor Designation Rate, Q4 2011 30-49% Median45.5%
Donor Designation Rate, Q4 2011 30-49% <30% Median45.5%
Summary: Donor Designation Rate, 2011 • 33 states reported a cumulative donor designation rate of 39.1% (median 45.5%) in 2011 • Donor designation rate increased year-over-year 21 of 29 states reporting
Donor Designation Rate, 2011 50%+ Median45.5%