Download
1 / 2
20 likes | 113 Vues
“QUALITY SOLDIERS:. ACQUIRE. TRAIN. QUALITY. QUALITY. QUALITY. STRUCTURE. DISTRIBUTE. SEPARATE. SUSTAIN. THE ESSENCE OF AMERICA'S ARMY”. ARMY DEMOGRAPHICS Demographic Profile FY98 Data, unless otherwise noted Produced By: Headquarters, Department of Army

E N D
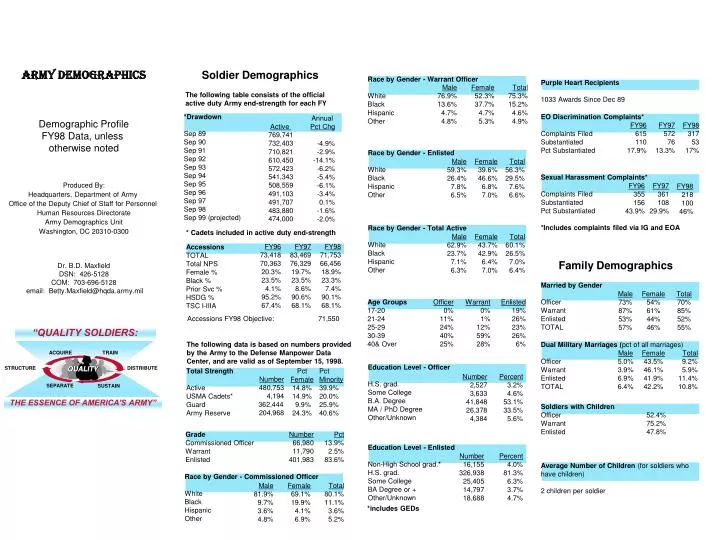
“QUALITY SOLDIERS: ACQUIRE TRAIN QUALITY QUALITY QUALITY STRUCTURE DISTRIBUTE SEPARATE SUSTAIN THE ESSENCE OF AMERICA'S ARMY” ARMY DEMOGRAPHICS Demographic Profile FY98 Data, unless otherwise noted Produced By: Headquarters, Department of Army Office of the Deputy Chief of Staff for Personnel Human Resources Directorate Army Demographics Unit Washington, DC 20310-0300 Dr. B.D. Maxfield DSN: 426-5128 COM: 703-696-5128 email: Betty.Maxfield@hqda.army.mil Soldier Demographics Race by Gender - Warrant Officer White Black Hispanic Other Purple Heart Recipients 1033 Awards Since Dec 89 Male 76.9% 13.6% 4.7% 4.8% Female 52.3% 37.7% 4.7% 5.3% Total 75.3% 15.2% 4.6% 4.9% The following table consists of the official active duty Army end-strength for each FY *Drawdown Sep 89 Sep 90 Sep 91 Sep 92 Sep 93 Sep 94 Sep 95 Sep 96 Sep 97 Sep 98 Sep 99 (projected) EO Discrimination Complaints* Complaints Filed Substantiated Pct Substantiated Annual Pct Chg -4.9% -2.9% -14.1% -6.2% -5.4% -6.1% -3.4% 0.1% -1.6% -2.0% FY96 615 110 17.9% FY97 572 76 13.3% FY98 317 53 17% Active 769,741 732,403 710,821 610,450 572,423 541,343 508,559 491,103 491,707 483,880 474,000 Race by Gender - Enlisted White Black Hispanic Other Male 59.3% 26.4% 7.8% 6.5% Female 39.6% 46.6% 6.8% 7.0% Total 56.3% 29.5% 7.6% 6.6% Sexual Harassment Complaints* Complaints Filed Substantiated Pct Substantiated *Includes complaints filed via IG and EOA FY96 355 156 43.9% FY97 361 108 29.9% FY98 218 100 46% Race by Gender - Total Active White Black Hispanic Other * Cadets included in active duty end-strength Male 62.9% 23.7% 7.1% 6.3% Female 43.7% 42.9% 6.4% 7.0% Total 60.1% 26.5% 7.0% 6.4% FY96 73,418 70,363 20.3% 23.5% 4.1% 95.2% 67.4% FY97 83,469 76,329 19.7% 23.5% 8.6% 90.6% 68.1% FY98 71,753 66,456 18.9% 23.3% 7.4% 90.1% 68.1% Accessions TOTAL Total NPS Female % Black % Prior Svc % HSDG % TSC I-IIIA Family Demographics Married by Gender Officer Warrant Enlisted TOTAL Male 73% 87% 53% 57% Female 54% 61% 44% 46% Total 70% 85% 52% 55% Age Groups 17-20 21-24 25-29 30-39 40& Over Officer 0% 11% 24% 40% 25% Warrant 0% 1% 12% 59% 28% Enlisted 19% 26% 23% 26% 6% Accessions FY98 Objective: 71,550 The following data is based on numbers provided by the Army to the Defense Manpower Data Center, and are valid as of September 15, 1998. Dual Military Marriages (pct of all marriages) Officer Warrant Enlisted TOTAL Male 5.0% 3.9% 6.9% 6.4% Female 43.5% 46.1% 41.9% 42.2% Total 9.2% 5.9% 11.4% 10.8% Education Level - Officer H.S. grad. Some College B.A. Degree MA / PhD Degree Other/Unknown Total Strength Active USMA Cadets* Guard Army Reserve Pct Female 14.8% 14.9% 9.9% 24.3% Pct Minority 39.9% 20.0% 25.9% 40.6% Number 2,527 3,633 41,848 26,378 4,384 Percent 3.2% 4.6% 53.1% 33.5% 5.6% Number 480,753 4,194 362,444 204,968 Soldiers with Children Officer Warrant Enlisted 52.4% 75.2% 47.8% Grade Commissioned Officer Warrant Enlisted Number 66,980 11,790 401,983 Pct 13.9% 2.5% 83.6% Education Level - Enlisted Non-High School grad.* H.S. grad. Some College BA Degree or + Other/Unknown Number 16,155 326,938 25,405 14,797 18,688 Percent 4.0% 81.3% 6.3% 3.7% 4.7% Average Number of Children (for soldiers who have children) 2 children per soldier Race by Gender - Commissioned Officer White Black Hispanic Other Male 81.9% 9.7% 3.6% 4.8% Female 69.1% 19.9% 4.1% 6.9% Total 80.1% 11.1% 3.6% 5.2% *includes GEDs
U.S. Population Statistics Health Issues U.S. Army Civilians HIV+ HIV+ Soldiers Active 278 AR/NG 62 Sole Parents Commissioned/Warrant Officer 3.5% Enlisted 8.2% TOTAL 7.4% Army Civilians* * Appropriated Fund civilian employees only FY90 539,417 Sep 98 205, 418 Population Age 17-19 by Race White Black Hispanic Other 1998 67.1% 14.9% 13.1% 4.9% 2000 66.7% 14.4% 13.8% 5.1% 2005 64.6% 14.7% 15.2% 5.4% 2010 61.1% 14.8% 17.9% 6.1% New Cases of HIV+ (Reserve Components) Calendar Year Army Civilian Employees by Gender and Grade (Appropriated Fund employees only) Male Female Total all pay plans GS 1-4 GS 5-8 GS 9-12 GS/GM 13-15 TOTAL GS SES Pct in Total Fed Gov (excl Postal) Family Members Spouses Children Adult Dependents TOTAL 1993 91 1994 65 1997 55 1995 67 1996 63 1998* 58 253,421 463,091 3,907 720,419 *1998 total is for Jan -Sep 98 Racial Composition of College Graduates Age 20-24 (as of FY97 ) White Black Hispanic Other FY90 57.4% 22.1% 29.2% 64.4% 86.0% 46.3% 95.1% Sep 98 59.9% 28.7% 32.9% 59.9% 78.8% 50.9% 88.5% 53.2% FY90 42.5% 77.8% 70.7% 35.5% 14.0% 53.6% 4.8% Sep 98 40.1% 71.3% 67.1% 40.1% 21.2% 49.1% 11.5% 46.8% Births to Unmarried Family Members in U.S. Army Hospitals (excludes spouses) Age FY94 FY95 FY96 FY97 FY98 82.3% 5.4% 5.1% 7.2% Avg Soldier’s Pay (E4, 5 years of service, married with 2 children) - at Fort Drum, Jan 99 Base Pay: BAQ: BAS: TOTAL 12-15 63 55 37 30 30 16-18 333 310 236 198 205 19+ 223 168 136 128 129 $1,429 per month 461 per month 254 per month $2143 per month $25,716 per year Positive Propensity for Active Army, Males Age 16-21** Deaths of Active Duty Soldiers by Selected Causes Total Accidents POV Mil Training Other Illness Suicides Homicide Hostile Action Terrorist TOTAL Army Civilian Employees by Minority Status and Grade(Appropriated Fund employees only) Majority Minority Total all pay plans GS 1-4 GS 5-8 GS 9-12 GS/GM 13-15 TOTAL GS SES Pct in Total Fed Gov (excl Postal) FY96 241 145 35 61 209 63 27 2 0 542 FY97 145 82 52 11 77 54 19 0 0 295 FY98 178 115 63 0 74 59 12 0 0 323 Food Stamps - vouchers redeemed in Army Commissaries, FY98 Food Stamps WIC* *Women, Infants and Children Program $7,145,607 $10,155,867 FY90 74.3% 61.9% 72.1% 81.3% 89.3% 75.0% 95.1% Sep 98 72.9% 53.1% 65.4% 77.1% 86.1% 72.3% 92.2% 70.6% FY90 25.7% 39.1% 27.9% 18.7% 10.2% 25.0% 4.8% Sep98 27.1% 46.9% 34.6% 22.9% 13.9% 27.7% 7.8% 29.4% Soldiers with Exceptional Family Members Soldiers Family Members FY 98 35,811 43,901 Pct 7.4% 6.1% Positive Propensity for Active Army, Females Age 16-21** Family Violence - Substantiated Spouse Abuse Number of Victims Rate/1,000 wives Rate/1,000 husbands Employment Status of Spouses (as of Spring 1998) Employed - Full-Time Employed - Part-Time Unemployed * Wants job but not looking Not working, doesn’t want job FY98 5,027 6.9 1.7 FY96 7,540 15.8 9.1 FY97 5, 370 7.0 1.8 U.S. Army Retirees *20+ Yrs of Service Disabled - Temporary Disabled - Permanent Other/ Unknown TOTAL Ofcr 30.3% 17.1% 9.9% 11.2% 31.5% Enl 36.7% 18.9% 19.4% 11.6% 13.4% Oct 98 552,839 2,870 92,103 32,712 680,524 *Includes Reserve Retired * Unemployed means actively looking for work. **Source: Youth Attitude Tracking Surveys Source: Sample Survey of Military Personnel