Download
1 / 25
250 likes | 406 Vues
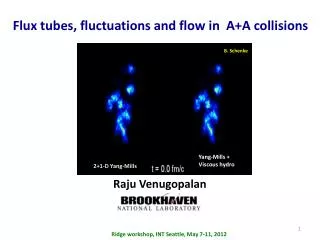
Flow Mow - a study of hydrothermal heat flux. Who : Russ McDuff, Fritz Stahr, Scott Veirs, Christian Sarason - (UW); Ko-ichi Nakamura - (GSJ); Al Bradley, Dana Yoerger - (WHOI) What : measuring heat flux from a whole vent field

E N D
Flow Mow -a study of hydrothermal heat flux Who: Russ McDuff, Fritz Stahr, Scott Veirs, Christian Sarason - (UW); Ko-ichi Nakamura - (GSJ); Al Bradley, Dana Yoerger - (WHOI) What: measuring heat flux from a whole vent field Where: Main Endeavour Vent Field, Juan de Fuca Ridge Why: constrain geophysical models, improve knowledge When: August 2000 -- among the ROBE crowd With: an AUV (ABE) and good sensors Funded by: NSF grant OCE-9872090. Thank you!
Motivations Constrain geophysical models 20% of crustal heat flux is through hydrothermal systems heat transfer location and quantity critical to ridge models Improve heat flux estimates prior results highly uncertain and disagree covered different spatial scales and vent types New technology allows new measurements AUVs available to cover area quickly accurate navigation allows more repeatable surveys new sensors allow better plume detection
Prior Results - Segment Scale 1700 ± 1100 MW Baker & Massoth, ‘87 3000 ± 2000 MW Rosenberg et al., ‘88 1000 ± 620 MW Thomson et al., ‘92 All used neutrally buoyant plume: not clear what’s included
Prior Results - Field Scale 6550 ± 3000 MW; Thomson et al., ‘92 9390 ± 74* MW; Schultz et al., ‘92 * diffuse only 154 ± 84* MW; Bemis et al., ‘93 * smokers only 364 ± 73* MW; Ginster et al., ‘94 * smokers only All extrapolated so highly uncertain, especially diffuse flow
Plan of Attack, part 1 - Measure the buoyant part of the plume Find best height to “mow” it using a model: MTT plumes (point sources) conserves mass, momentum, heat, salt 200 x 400 m horizontal plane sampling with “real” uncertainties … says 75-100 m is the best!
Plan of Attack, part 2 -Team up with a robust & capable AUV The Autonomous Benthic Explorer
Plan of Attack, part 3 - put good sensors on ABE Temperature - Sea Bird CTDs (ducted & pumped) Velocity - MAVS current meter plus vehicle tracking/velocity Area - use new “plume-sniffers” e.g., redox potential (Ko-ichi Nakamura)
Execute, part 1 - good background data Microtopography (Imagenix on ABE) 40- CTD stations (backgrounds, time-series, curtains) Currents (mooring, 5 @ 50m intervals)
Execute, part 2 - fly ABE around box Fly all sides of a box surrounding the vent field -- obtained one N/S/E/W sides & two further N/S sides Because most flux is vertical, fly as many box-tops as possible -- did 12 total
Execute, part 3 - Process Data Heat-flux (Watts) = [ACp () w ] Area from actual track length x nominal spacing Cp from average T, S, P for whole top from CTD & background measurements Vertical velocity (w) from MAVS minus ABE or from ABE dynamic model from CTD Sum for each point over whole track
Contours of ABE-48, Top 1 heat-flux = 670 MW
Contours of ABE-50, Top 1 heat-flux = 528 MW
Results (to date) -Average heat-flux = 588 ± 168 MW Calculated from ten tops with background = 0.063 subtracted 0.063 from mean of ABE-50 side-walls, represents avg. background heat (more on this later) background heat an issue for all prior results
More of the fine print... Currents are highly variable in time & space Therefore flux through sides is variable (more on this later)
Summary of Flow Mow ABE work Measured heat-flux over the Main Endeavour Vent Field more precisely than previously Using this technique, variations in vent-field scale heat-flux can be tracked in space and time, repeat occupations necessary More results coming from finding N/S side fluxes from combined ABE, CTD and current meter data combined CTD “curtains” and ABE-51 data to look at neutrally buoyant plume flux
Endeavour Segment Currents Means from July-Oct, 2000 (74 days, hr averages) ~5cm/s above ridge crests, intermittently to the SW or W ~2cm/s within axial valley, predominantly to the N
Hodographic histograms Low velocities to W Symmetry at 100mab Strong shear between valley and ridge tops
Progressive vector diagrams Upper flow to SW, but with NW event, ~20d Top 3 ~uniform Minimal transport at ridge crest elevation Northerly net flow within valley
Regional hydrography, part 1 Near-field hydrography is variable on tidal time scales.
Regional hydrography, part 2 Near-field hydrography is spatially variable on tidal time scales also.
Regional hydrography, part 3 The axial valley is generally thermally contaminated, but even in the Main Field, background water is present.
Ongoing issues... Flux out the MEF control volume can be calculated by 1) subtracting “background”, and/or 2) integrating fluxes through all sides Background heat may be 0.063 or less. Resolving variations in currents is critical to more accurate side wall heat flux estimates


![Heat Flux [Wm -2 ]](https://cdn3.slideserve.com/5899967/heat-flux-wm-2-dt.jpg)