Download
1 / 31
310 likes | 416 Vues
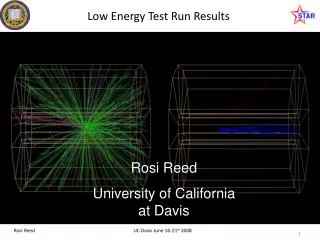
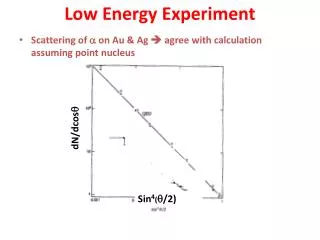
Low Energy Test Run Results. Rosi Reed University of California at Davis. Introduction. Event quality Beam Pipe Events Spectra HBT Beam Profile Analysis. 2. Summary 9 GeV Test Run. 5.5 % with Vertex. 3.3% with Vertex r < 2 cm. Yellow = cogged at Phenix.

E N D
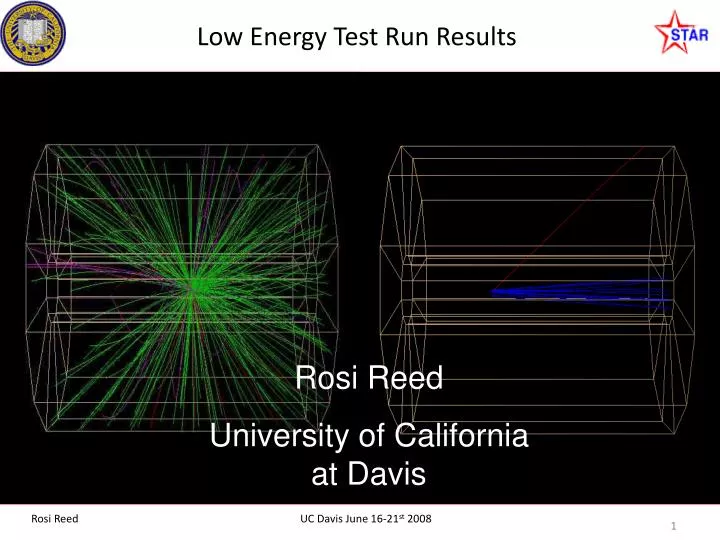
Low Energy Test Run Results Rosi Reed University of California at Davis
Introduction Event quality Beam Pipe Events Spectra HBT Beam Profile Analysis 2
Summary 9 GeV Test Run 5.5 % with Vertex 3.3% with Vertex r < 2 cm Yellow = cogged at Phenix
Multiplicity – Cut on Events heading into the TPC 62.4 GeV points are scaled to match 3.2 GeV points at Nch = 13 Au-Al + Alpha-Al Au-Al An increased yield in low multiplicity events could be the result of alpha particles from Au break-up hitting the beam pipe 30% Central
Au-Al HBT Analysis – Rigidity t p d π- π+
Eta for Au-Al Events Events with a Negative Average Eta Flipped for Graphs 2-4 All All 2 1 30% Central 30-100% Central Increase at Eta = 0 from Spectators from Al 4 3
Eta for Au-Al Events 30% Central Proton 30% Central Pion PID done through nSigma cut 30-100% Central Pion 30-100% Central Proton
Pion+ Proton Yield for Au-Al Eventsybin = 0.5 around ycm T ~ 80 +/- 2 MeV T ~ 91 +/- 3 MeV T ~ 99 +/- 4 MeV No efficiency corrections made
Proton/Pion Ratio for Au-Al Events Increase in p vs pi at y = 0 comes from Al spectators
Event quality cuts: Vr > 2 cm (Not Au+Au collisions) |Vz| > 75 cm (Not Au+Be collisions) Vz*TotalEventPz < 0 (Events “into” TPC) Events with Pz < 0 flipped (pz = pz*-1) Multiplicity > 10 (30% Central) Track Quality cuts: Assumed all negatively charged tracks were pions nHits/nPossHits > 0.5 for either TPC or FTPC Au-Al HBT Analysis (root SNN = 3.2)
Analyzed Vx vs Vy distributions vs time for Run 72 (13:26:02 – 28:25) Run 73 (13:36:10 – 13:37:30) Run 74 (43:12 – 44:21) Binned distributions with the same Vernier scan location No Z vertex cuts Cut on Vr < 2 Beam profile vs time
Gaussian Multiplication • Beam is gaussian in shape • Distribution of collisions in xy space is equal to the beam distributions multiplied by each other • Also gaussian in shape
Beam profile vs time Summary # Beam-Beam Events Calculated from Vx vs Vy distributions Blue = Run 72, Yellow Run 73, Grey Run 74
Beam Sigmas Beam Sigmas calculated from formula on pg 15 Error bars reflect statistical error only Sigma X = 1.75 mm +/- .20 Sigma Y = 2.40 mm +/- .15 If our assumptions are correct, these distributions should be flat
Vernier Scan Versus Average Event Location Slope should be +/- 0.5 if our assumptions were correct
Time Decay for Run 97 Empty events fall off exponentially Beam-Beam and Empty Events have the same time constant Beam-Pipe events have twice the time constant of Beam-Beam and Empty Events Run 97 occurred after BBC threshold was lowered
Events During Vernier Scan During Vernier Scan it appears the empty event rate follows the beam-beam event rate in runs 72 and 73.
We still do not understand why we triggered Empty events BBC threshold changed but the trigger rate still seems to be beam related Beam-Pipe Events Beam Pipe events are a combination of Au-Pipe Material and Alpha-Pipe Material We have a reasonable estimate of the good event rate Conclusion
Z Axis distributions 3.6 AGev Au+Al 3.6 AGev Au+Al 3.6 AGeV Au+Be Thin Be beam pipe extends from Z = -75 cm to 75 cm. Outside 75 cm there is a thicker Al beam pipe.
Number of Vertices per Event • 78.9% of events had 1 primary vertex • 81.6% of “beam-beam” events have 1 primary vertex • 71.6% of “beam-pipe” events have 1 primary vertex (Data taken from runs 97,76,72) 26
XY Location of 2nd + 3rd Vertices for Events with Vertex 1 r > 2 cm Only 8 % of secondary vertices and 8 % of teritary vertices of events labeled as beam pipe events are located in the center Indicates that most events labeled as beam pipe events are not Au-Au events that have kicked off an energetic particle. Data from Runs 97, 76, 72
Average Eta by Event Run 97, 76, 72 Eta averaged over primary tracks only 28