Download
1 / 40
400 likes | 551 Vues
SIMS 247: Information Visualization and Presentation. Software Architectures for Information Visualization Oct 17, 2005. infovis history. interactive tasks [Shneiderman]. Overview Get an overview of the collection Zoom Zoom in on items of interest Filter Remove uninteresting items

E N D
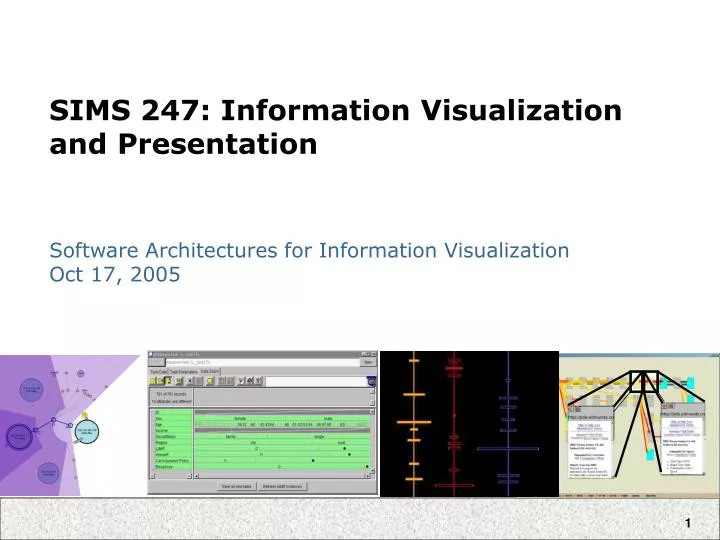
SIMS 247: Information Visualization and Presentation Software Architectures for Information Visualization Oct 17, 2005
interactive tasks [Shneiderman] • Overview • Get an overview of the collection • Zoom • Zoom in on items of interest • Filter • Remove uninteresting items • Details on demand • Select items and get details • Relate • View relationships between items • History • Keep a history of actions for undo, replay, refinement • Extract • Make subcollections
software architectures for infovis • what tools should be provided? • (in-class brainstorm)
overview • modeling visualizations • existing infrastructures • platform demos • processing • prefuse • administrivia
Data Visual Form Task Raw Data Data Tables Visual Structures Views Data Transformations Visual Mappings View Transformations infovis reference model • Data Transformations • Mapping raw data into an organization fit for visualization • Visual Mappings • Encoding abstract data into a visual representation • View Transformations • Changing the view or perspective onto the visual representation • User interaction can feed back into any level
reference model examples • Visual mappings • Layout (assigning x,y position) • Size, Shape, Color, Font, etc… • View Transformations • Navigation: Panning and Zooming • Animation • Visual Distortion (e.g., fisheye lens)
apply the model: cone trees • Raw Data: File system directories • Data Transformations: Traverse file system subtree • Data Tables: Parsed/extracted directory tree • Visual Mappings: Assign 3D coordinates to tree elements (layout), assign colors, fonts. Set lighting. • Visual Structures: 3D model of tree • View Transformations: Camera placement; animation between tree configurations • View: Rendered, interactive visualization • Interaction: Selection of new focus node
overview • modeling visualizations • existing infrastructures • platform demos • processing • prefuse • administrivia
building from scratch • graphics / rendering interface • drawLine, drawRect, drawText, drawImage • transformations (e.g., scale transform for zooming) • interaction system • callbacks to process mouse and keyboard events • data and geometry representations • how is the data modeled and manipulated? • how are visual items modeled? • many different approaches available for facilitating these aspects
Common Platforms • flash • 2D Vector Graphics engine • Supports drawing, animation, transforms • Available on most people’s computers • More advanced work by coding in ActionScript • Supports data loading from network using XML • HTML/CSS/Javascript (AJAX) • Runs right in the web browser • Somewhat messy programming model • For visualization, issues with scale • Difficult to implement advanced visual applications
processing [Fry & Reas] • a simplified java-based graphics library • simplifies programming of 2D + 3D graphics • intended to lower threshold for programming visual applications • includes an integrated development environment using a sketchbook metaphor, exports to applets • active user community, many extensions and examples are available online • connection to infovis • does not currently support infovis with any high-level abstractions • very useful for prototyping ideas, or as an underlying graphics platform • http://processing.org
thinking machine 4 martin wattenberg
existing toolkits information visualizer graphviz / jung / pajek jazz / piccolo infovis toolkit
a hierarchical approach • widget hierarchies • extension by subclassing • typing is static • often can’t decompose visualizations into compositions of basic techniques • monolithic toolkits • those that primarily use compile-time inheritance to extend functionality • [Bederson et al] • Visualization • Layout • Render • New Visualization • Layout (override)
a compositional approach Visualization Layout Size Render Color + + + Other Layout New Layout • Chain together desired components • Extend/replace techniques directly • Directly add new components (or lists of components) to customize visualizations • Enables dynamic changes in composition • polylithic toolkits • those that primarily use run-time composition to extend functionality [Bederson et al]
design trade-offs • hierarchical model cited as easier for programmers • fits existing programming models well • less code for common cases • compositional model provides more flexibility and dynamic behavior • easier to add and extend behaviors • vital for prototyping novel visualizations • what are the implications for systems by which non-programmers could build visualizations?
Piccolo • user interface toolkit for zoomable interfaces • Descended from Pad, Pad++, Jazz • Extensible 2D Visual Objects (text,shapes,images) • Support for Zooming and Animation • Versions for Java, C#, and Pocket C# • connection to infovis • very popular and robust platform for building your “geometry” and view tiers. • does not provide high-level visualization abstractions • http://www.cs.umd.edu/hcil/piccolo
Authoring Piccolo Applications • structure visual items in a scenegraph • create custom visual items through compositing or subclassing existing items • write interaction code (e.g., mouse listeners)
datelens spacetree
infovis toolkit [Fekete04] • extensible collection of infovis ‘widgets’ • scatterplot, treemaps, graph visualizations, etc • unified data model, similar to database • general interactive components • dynamic queries, distortion lenses, excentric label • missing a dedicated “geometry” tier • underlying data and visual abstraction interleaved • http://infovis.sourceforge.net
prefuse • User interface toolkit for writing highly interactive infovis applications (in Java) • Supports node-link diagrams, containment diagrams, collections, scatterplots, timelines… • Fine-grained component-based design, rooted in theoretical model for infovis • http://prefuse.sourceforge.net
infovis reference model DATA VISUAL FORM VIEW filtering rendering • Separation of data and visual items • Enables filtering and transformation • Separation of visual items and rendering • Enables dynamic control of appearance (e.g., semantic zooming) and graphics transforms • User interaction can feed back into any level User Abstract Data Visual Analogues Display
prefuse implementation DATA VISUAL FORM VIEW filtering rendering User Abstract Data Nodes, Edges Visual Analogues VisualItems in ItemRegistry Display Interactive Display RendererFactory I/O Libraries ActionList UI Controls Renderers Filter Layout Color Size
prefuse implementation Data structures for structured (graphs, trees) and unstructured data DATA VISUAL FORM VIEW filtering rendering User Abstract Data Nodes, Edges Visual Analogues VisualItems in ItemRegistry Display Interactive Display RendererFactory I/O Libraries ActionList UI Controls Renderers Filter Layout Color Size Readers and Writers for data I/O
prefuse implementation An ItemRegistry manages all visual items, maintains caches and rendering queues. DATA VISUAL FORM VIEW filtering rendering User Abstract Data Nodes, Edges Visual Analogues VisualItems in ItemRegistry Display Interactive Display RendererFactory I/O Libraries ActionList UI Controls Renderers Filter Layout Color Size Composable lists of Actions perform data processing: filtering, layout, color, size, font, etc. ActionLists are run in sequence by a generalized ActivityManager.
prefuse implementation Displays present the visualization and support interface callbacks and graphics transforms (e.g., pan and zoom). DATA VISUAL FORM VIEW filtering rendering User Abstract Data Nodes, Edges Visual Analogues VisualItems in ItemRegistry Display Interactive Display RendererFactory I/O Libraries ActionList UI Controls Renderers Filter Layout Color Size A RendererFactory assigns Renderers to visual items for drawing and bounds calculation.
prefuse implementation The user (possibly you). DATA VISUAL FORM VIEW filtering rendering User Abstract Data Nodes, Edges Visual Analogues VisualItems in ItemRegistry Display Interactive Display RendererFactory I/O Libraries ActionList UI Controls Renderers Filter Layout Color Size User interface controls allow direct interaction with visualizations (e.g., dragging, brushing, focus selection)
prefuse library components Renderers Actions Filters - graph, tree, fisheyes, … Assignment - color, size, font, … Layout - random, circle, treemap, outline, radial, force-directed… Distortion - bifocal, graphical fisheye Animators - linear location, polar location, color, font, size • Controls • Focus, Drag, Select • Highlight, Pan, Zoom • Extras • Physics simulation • Integrated search • Event logging and playback
evaluation - usability study • qualitative usability study of the prefuse API • 8 participants • 4 compsci students (2 grad, 2 undergrad) • 3 professional programmers / ui designers • 1 infovis expert • 3 tasks, given a network dataset: • Create a static visualization with random layout • Apply layout and some form of color mapping • Add animation or interactivity • study experience • 20 minute tutorial, read through reference handout and perform code walkthrough of a demo • 1 hour to work on tasks using think-aloud protocol, sessions were video-taped • post-study interview, audio-recorded
usability study - results • 7/8 completed every task • Overall reactions highly positive • Issues uncovered • Difficulties with filters + data transformation • Misleading naming conventions • General observations • Copy-and-paste bricolage • Minimal use of provided documentation
future directions • refinement of existing models • integration of advanced data modeling with visualization architecture • richer component libraries • visualization “export” features • (all have been developed in different projects) • tools for non-programmers • declarative construction of visualizations • Spotfire, Tableau, and others allow this at one level • how best to extend to richer, more nuanced design?
administrivia • Any issues with Assignment 2? • Next assignment (project proposal) is online. • Please send in your Tableau histories! • Next time: begin section on visualizing specific data types. First up: temporal data.
building a visualization // create graph and registry Graph g = new XMLGraphReader().loadGraph(datafile); ItemRegistry registry = new ItemRegistry(g); // intialize renderers Renderer nodeR = new TextItemRenderer(); Renderer edgeR = new DefaultEdgeRenderer(); registry.setRendererFactory( new DefaultRendererFactory(nodeR, edgeR)); // initialize action lists ActionList layout = new ActionList(registry); layout.add(new TreeFilter(true)); layout.add(new RadialTreeLayout()); layout.add(new ColorFunction()); ActionList animate = new ActionList(registry,1500); animate.setPacingFunction(new SlowInSlowOutPacer()); animate.add(new PolarLocationAnimator()); animate.add(new ColorAnimator()); animate.add(new RepaintAction()); animate.alwaysRunAfter(layout); // initialize display Display disp = new Display(registry); disp.setSize(500,500); disp.addControlListener(new DragControl()); disp.addControlListener(new FocusControl(layout)); // initialize enclosing window frame JFrame frame = new JFrame("prefuse example"); frame.getContentPane().add(disp); frame.pack(); frame.setVisible(true); // run the layout list layout.runNow(); initialize data set renderers filter, layout, color animated transitions initialize display add display to window start it running
extending a visualization ForceSimulator fsim = new ForceSimulator(); fsim.addForce(new NBodyForce(-0.1f, 15f, 0.9f)); fsim.addForce(new DragForce()); ActionList forces = new ActionList(registry, 1000); forces.add(new ForceDirectedLayout(fsim, true)); forces.add(new RepaintAction()); forces.alwaysRunAfter(animate); add force-based jitter Display overview = new Display(registry); overview.setBorder( BorderFactory.createLineBorder(Color.BLACK, 1)); overview.setSize(50,50); overview.zoom(new Point2D.Float(0,0),0.1); display.add(overview); display.addControlListener(new PanControl()); display.addControlListener(new ZoomControl()); add overview, pan, and zoom