Download
1 / 24
240 likes | 346 Vues
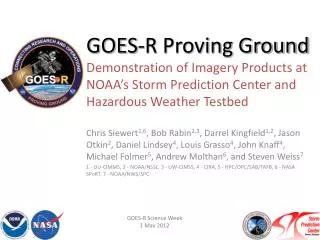
Science Evolution in the GOES-R Era. Mitch Goldberg Chief, Satellite Meteorology and Climatology Division Office of Research and Applications NOAA/NESDIS GOES-R Users Conference May 10, 2004. Science evolution is driven by the increasing need for information.

E N D
Science Evolution in the GOES-R Era Mitch Goldberg Chief, Satellite Meteorology and Climatology Division Office of Research and Applications NOAA/NESDIS GOES-R Users Conference May 10, 2004
Science evolution is driven by the increasing need for information NOAA’s major responsibility is to provide the Nation with information on changes in: • Climate • Weather • Ocean and Land Ecosystems • Hazards (fire, drought, air quality, volcanic eruptions, aviation) The required precision of information is always increasing
More information has resulted in the need for better observations Evolving from low to much higher vertical resolution sounders Evolving from imagers with few to many spectral regions Evolving from relatively poor to much better temporal and spatial coverage Evolving from marginal to very good long-term sensor stability Spectral, spatial, temporal and radiometric
Evolving observations result in more capabilities HES Products: Water vapor (soundings, fluxes, winds) Temperature (sounding, stability) Carbon monoxide concentration (2 Layers) and total CO2 conc. Methane concentration (total column) Ozone concentration (4 Layers) Surface Temperature and emissivity Clouds (altitude, optical depth, microphysical properties, winds) Aerosol Concentration and Depth
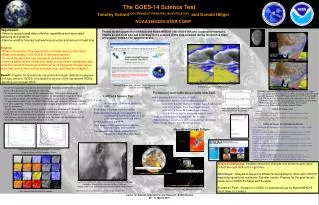
Dust detection using AIRS Larrabee Strow, UMBC
Our retrieval studies have demonstrated accurate AIRS retrievals in clear (solid) and even in cloudy conditions (dash curve) AIRS performance is much better than AMSU even in cloudy conditions 50 % coverage
Better observations require more and accurate science algorithms • Radiances • Atmospheric Soundings • Winds • Clouds • Surface • Composition (trace gas and aerosol) • Radiation Budget • Data and Product Access and Visualization
Evolving Science for Atmospheric Soundings • Required Activities: • Operational and time efficient generalized/multiple-level cloudy radiative transfer equation development • Hyperspectral IR Clear/cloudy detection algorithm development • Surface and Cloud Emissivity Modeling • Forward Model Error Quantification and Bias Adjustments • Clear and cloudy sounding retrieval algorithm • Quantification of Retrieval Error and Error Correlation • Visualization tools for nowcasting applications
Cirrus Cloud “Venetian Blind Effect” Depressions due to Cloud Attenuation 16.0 UTC 13.8 Temperature (K) 14.9 Log10{VMR (g/Kg)} These retrievals, uncorrected for cloud attenuation, demonstrate the ability of a high spatial resolution sounder to sense the spatial structure of moisture below a scattered and semi-transparent cirrus cloud cover
Evolving science and applications require new partnerships between government, academia, industry and stakeholders • Government scientists working with academia will lead the development of scientific algorithms to meet the needs of our stakeholders. • Government working with industry will lead the development of product processing, archive and distribution systems. • Industry will provide the sensors based on Government and stakeholder requirements.
Examples of Government and Academia Scientific Partnerships with Industry • Government /Academic (G/A) scientists can conduct trade studies and predict retrieval accuracy based on industry predicted sensor performance. • G/A scientists can help in the prelaunch characterization of sensors. • Industry can help in designing state-of-the-art data processing and visualization systems in addition to sensor development.
Improved observations require adequate and sustained resources for data utilization • Weather and Water • Improved hurricane trajectory forecasts. • Improved severe weather warnings • Improved agriculturing forecasting and nowcasting • Improved air quality monitoring and forecasting • Improved short to medium range weather forecasts. • Climate • Resolve climate-relevant (diurnal, seasonal, and long-term interannual) changes in atmosphere, ocean, land and cryosphere. • Hourly high spectral resolution infrared calibrated geo-located radiances facilitate radiance calibration, calibration-monitoring, and satellite-to-satellite cross-calibration of the full operational satellite system • Ecosystems and Coastal Water • First time ever, characterization of diurnal ocean color as a function of tidal conditions and observation of phytoplankton blooms (e.g. red tides) as they occur. • Improved coastal environment monitoring of a) response of marine ecosystems to short-term physical events, such as passage of storms and tidal mixing; b) biotic and abiotic material in transient surface features, such as river plumes and tidal fronts; and c) location of hazardous materials, such as oil spills, ocean waste disposal, and noxious algal blooms • Commerce • Better information regarding conditions leading to fog, icing, head or tail winds, and development of severe weather including microbursts en route makes air traffic more economical and safer. Better depiction of ocean currents, low level winds and calm areas, major storms, and hurricanes (locations, intensities, and motions) benefits ocean transportation. Information regarding major ice storms, fog, flooding and flash flooding, heavy snowfall, blowing snow, and blowing sand already assists train and truck transportation. • Power consumption in the United States can be regulated more effectively with real-time assessment of regional and local insolation as well as temperatures.
Increasing growth of satellite data has resulted in new interagency organizational structures • The Joint Center for Satellite Data Assimilation (JCSDA) was created to accelerate the use of satellite data in NWP and is partnership between NOAA, NASA, DOD scientists and academia. • Board of Directors, Science Steering Committee, annual announcement of opportunities • JCSDA will be responsible for utilizing GOES-R data for NWP applications.
PARTNERS NOAA/NCEP Environmental Modeling Center NOAA/OAR Office of Weather and Air Quality NASA/Goddard Global Modeling & Assimilation Office US Navy NOAA/NESDIS Oceanographer of the Navy, Office of Naval Research (NRL) Office of Research & AF Director of Weather AF Weather Agency Applications US Air Force JCSDA Partners
Climate Utilization – NOAA is developing a new program for creating climate data records with the following functional areas • Observing System Performance Monitoring • Detect problems early • Production of near real-time CDRs • Monitor current state of climate system and short -term variations • Reprocessing of CDRs for long-term records • Consistent, seamless, high quality time series with minimized bias • Climate research and applications • Joint activities with external community • Archive and distribution • Includes output of above activities, metadata, and timely distribution Above are guided by climate science teams – experts in instrument characterization, algorithms, validation, data management, applications, and observing system performance monitoring
Evolving Requirements, Evolving Science, Evolving Applications Air Quality Data Compression
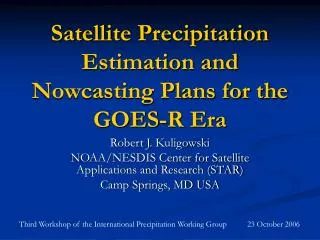
Air Quality Satellite Objectives • Monitor Inter-continental /regional dust/pollution transport • Identifying sources of pollution (hot spots) • Urban/industrial pollution • Fires and bio-mass burning /emission attributes • Dust storms • Improved forecasting of air pollution events so mitigating strategies can be applied in advance
Transport of Smoke from Canadian Fires July 6, 2002 Transport of smoke to the New York/Pensylvannia region July 7, 2002 Smoke covers most of the new England region reaching as far down as North Carolina. Burning eyes and dirty air quality reported over much of B-W area July 8, 2002 Smoke blown off of the coast over the Atlantic
Limitations of Current GOES Imager • Single Visible Channel Retrieval • Identification of aerosol size/type not possible • Uncertainties in estimation of surface contribution • No on-board calibration source • GOES Aerosol Retrieval Algorithm • Dependence on a priori information • Assumptions of aerosol model • However future GOES-R will significantly improve capability
Data Compression Issues • The volume of hyperspectral is huge!! • Data compression can have applications in a number of areas: • downlink –rebroadcast - distribution - archive • Data compression team is investigating optimal techniques (both lossless and lossy)
PCA (EOF) compression The residuals are at noise levels and can be compressed and stored in a separate file for lossless compression Most people will not want the residuals. The picture to the left can be also used as a form of metadata to demonstrate the accuracy of the compression. Users can decide whether they want the residual file AIRS Ozone Band 50 – 100 Compression Ratios Goal: Provide users with easier access to high volume data – to promote utilization and research
Summary • Emerging requirements addressing the Nation’s present and future environmental concerns are driving new requirements in science, applications, sensor technology, and data utilization. • The tremendous wealth of information and applications will require new partnerships between government, academia and industry • GOES-R will be a critical part of a larger and continuously evolving integrated observing system which will require extensive research and operational activities. • These activities will require new ways of doing business, for example, Scientific Data Stewardship