Download
1 / 24
240 likes | 408 Vues
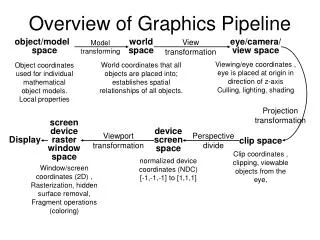
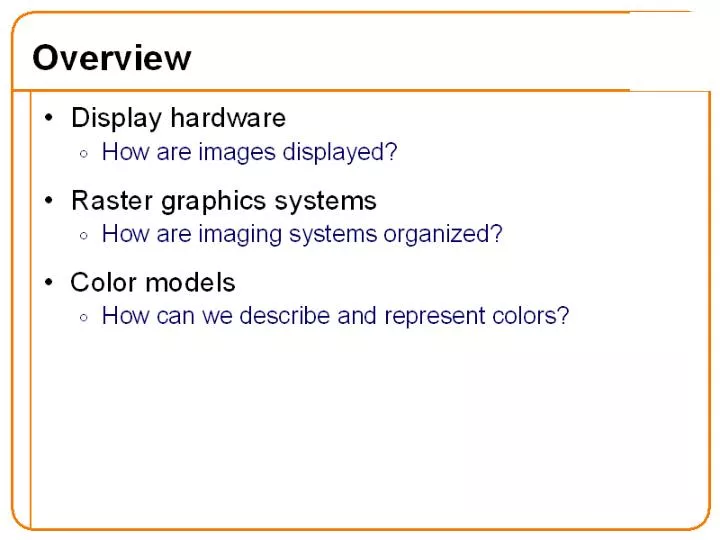
Overview of Graphics Systems. Cathode-ray Tube (CRT) . - colors are represented using Red, Green, and Blue components - the CRT has a mechanism for displaying these three components - grayscale can be represented by making R, G, and B equal . Display Technologies Cathode Ray Tubes (CRTs) .

E N D
Cathode-ray Tube (CRT) - colors are represented using Red, Green, and Blue components - the CRT has a mechanism for displaying these three components - grayscale can be represented by making R, G, and B equal
Display Technologies Cathode Ray Tubes (CRTs) • Most common display device today • Evacuated glass bottle (last remaining vacuum tube) • Heating element (filament) • Electrons attracted to focusing anode cylinder • Vertical and Horizontal deflection plates • Beam strikes phosphor coating on front of tube
Cathode Ray Tubes • Different phosphors have different : • Color • -red • -green • -blue • Persistence : how long they continue to emit light The image must be refreshed to avoid flicker, typically at least 60Hz, through 72H is easier on the eyes.
Frame Buffer 01001101 DAC Frame Buffer Monitor Intensity of the raster scan beam is modulated according to the contents of a Frame Buffer Each element of the Frame Buffer is associate with a single pixel on the screen
Electron beam traces over screen in raster scan order • Each left –to right trace is called a scan line • Each spot on the screen is a pixel • When the beam is turned off to sweep back, that is a retrace, or a blanking interval • B/W TVs are basically oscilloscopes (with a hardwired scan pattern) • Entire screen painted 30 times/sec • Screen is traversed 60 times/sec • Even/Odd lines on alternate scans (called fields) • Smooth motion on dynamic scenes • High Resolution on static scenes • Optimize bandwidth Raster Displays
Resolution The maximum numbers of the points that can be displayed without overlap on a CRT is referred to as the resolution. Typical resolution on high-quality systems is 1280 x 1024. • The display’s “resolution” is determined by : • Number of scan lines • Number of pixels per scan line • Number of bits per pixel • A system with 24 bit per pixel and a screen resolution 1024 by 1024 requires 3 MB of storage for the Frame Buffer.
Aspect Ratio Frame aspect ratio = horizontal/vertical size. An aspect ration of ¾ means that a vertical line plotted with three points has the same length as a horizontal line plotted with four points TV 4/3 35mm film 3/2
RGB color model versus indexed color model - in the RGB color model, the frame buffer stores the RGB components for every pixel in the indexed color model, the frame buffer stores an index into a color-lookup table
Raster Display • Disadvantages • Requires screen-sized memory array • Discrete spatial sampling (pixels) • Moire patterns result when shadow-mask and dot-pitch frequencies are mismatched • Convergence (varying angles of approach distance of e-beam across CRT face) • Limit on practical size (< 40 inches) • Spurious X-ray radiation • Occupies a large volume • Advantages • Allows solids to be displayed • Leverages low-cost CRT H/W (TVs) • Whole Screen is constantly updated • Bright light-emitting display technology
Gamma parameter - intensity output is not a linear function of voltage input - the shape of the curve may be represented by a power function y = xa -x is the input voltage - a is the gamma parameter - typically 2.2 - y is the light intensity output - http://www.libpng.org/pub/png/spec/PNG-GammaAppendix.html - http://www.inforamp.net/%7Epoynton/index.html -concept and terminology originated w.r.t. film
Displaying images in Java - Example We start by writing what is called a Java applet. This is a form of a Java program that can be embedded in a HTML document and accessed from the web. An example HTML document that calls our example applet is shown below: HTML> <HEAD> <TITLE>Demo Applet </TITLE> </HEAD> <BODY> </H1> <CENTER> <APPLET code="Demo.class" width=200 height = 200> </APPLET> </CENTER> <HR> </BODY> </HTML>
Review of Raster Displays • Display synchronized with CRT sweep • Special memory for screen update • Pixels are the discrete elements displayed • Generally, updates are visible
High-end Graphics Display System • Adds a second frame buffer • Swaps during vertical blanking • Updates are invisible • Costly
Implementing a Memory Raster Object • Maintains a copy of the screen (or some part of it) in memory • Relies on a fast copy • Updates are nearly invisible • Conceptual model of a physical object
Pixels stored as ints in the array called pixel[] • Java's standard model of a pixel Lets talk about Pixels /** * This constructor creates an Raster initialized with the contents of an image. */ public Raster(Image img) { try { PixelGrabber grabber = new PixelGrabber(img, 0, 0, -1, -1, true); if (grabber.grabPixels()) { width = grabber.getWidth(); height = grabber.getHeight(); pixel = (int []) grabber.getPixels(); } } catch (InterruptedException e) { } }
A Java Model of a Memory Raster Here is the source for the Raster object • Here is the source for the Raster object