Download
1 / 19
190 likes | 214 Vues
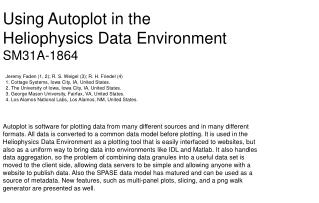
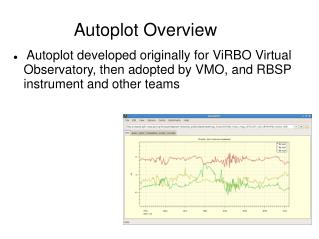
Autoplot is an intuitive Java-based software that reads data from diverse sources like CDF, netCDF, Excel, and JPG. It offers automatic rendering methods, data slicing, and advanced plotting features. With support for scripting and various output formats, Autoplot simplifies data analysis and visualization tasks.

E N D
Autoplot Virbo meeting Boulder Aug 2008
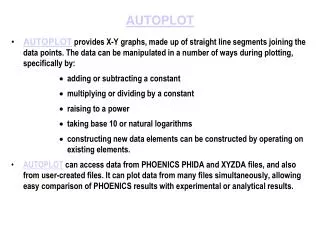
Introduction to Autoplot • “plot anything” software • java-based • Reads data from many sources • Abstract File formats: CDF, netCDF • Common formats: Excel, .JPG • API’s: OpenDAP, das2Server, ODBC • Low level: ASCII tables, Binary tables
Introduction—Automatic… • Tries to present reasonable view of data: • rendering method (line vs spectrogram) • Axis ranges and log/lin • When metadata is available (e.g. CDF) • Axis labels • Fill data
Introduction—DataSources • DataSources are plugins that convert URL to plottable DataSet (QDataSet) • DataSources provide metadata in tree-structure, maybe along with MetaDataModel that is used to interpret the metadata. • DataSources provide completion engine and (soon) GUI for creating URLs.
Axis Tab for Control • Axis ranges, log/linear, labels • Plot Title • Valid range and fill value (e.g. ascii table) • Disable “auto” controls • Rank Reduction
Rank Reduction Autoplot only plots 2-D graphics • Datasets must be “rank” 1 or 2 • Rank 1 is displayed as lineplot • Rank 2 spectrogram (unless DEPEND_1 is coordinate dimension) • Rank 3 can be “sliced” to reduce dimension • Pick dimension to slice. It tries to guess best slice dimension based on names like (Lat,Lon,Angle) • Pick index to slice. Axis ranges are preserved, so you can make comparisons between indexes. Mousewheel controls.
Autoplot Tabs • Axis: described already • Style: style preferences • Symbol color and shape • Spectrogram rebin-to-pixel method (NN or Interpolate) • Metadata: information about the plotted dataset • Script: Editor for Jython scripts • All tabs undock with mouse drag
Features, features • “Browser for Data on the Web”—look for browser features • Bookmarks • Downloaded resources cache. (plus controller) • Unlimited undo/redo support • Save/Load state to .vap file • Option to embed data into .vap
Metadata Tab • Tree GUI for inspecting DataSource metadata • Statistics tree node (mean, std.dev, count) • QDataSet node for inspecting properties and digital data.
Mouse Features • Come via das2 plotting library • Right-click on plot to select action • Box zoom default • Crosshair digitizer • Vertical and Horizontal slicing • Length can show fit model • Display digital data within box
Print to… • Print to printer • SVG, increasingly supported format • PDF • much effort to make PDF and SVG output hackable for publication (e.g. tweak labels) • PNG
Export Data to… • DataSources can provide formatting as well • ASCII tables • Binary tables • Das2streams (serial version of QDataSet) • Excel (why not) • CDF
Scripting Support • Provides way to drive internals directly • Autoplot presents API to script • Applications: • Batch processing: for each datafile, make a plot • “Mash up” data sources • Process data: pile of gifs to array of timetags • Tweak data: add physical units to ascii table
Script Tab • JythonDataSource is DataSource that runs script, then plots the result • Script tab displays loaded jython script for reference • Allows editing of script as well. • “minimally useful” IDE for creating scripts • Execute this script • Error annotation when error is encountered
Autoplot Containers • Java application run on client via webstart • Webstart downloads and installs software • Java applet that runs within browser • Only a few DataSources work in this mode • Server-side servlet • URL is POST request • .png image is returned • Support thin-clients
Autoplot Limitations • Only one dataset can be plotted • Shortcomings with Vectors and Rank 3 • Application State support (undo/redo, save/load) isn’t comprehensive • das2 property editor allows changes that aren’t reflected • Still buggy
What’s Coming • VMO and Plasma Wave Group are supporting Autoplot • more DataSources • Overplots, Stack Plots, multiple Canvases • Uniform, comprehensive DOM • State support • Scripting