Download
1 / 8
90 likes | 294 Vues
MAPPING OF OIL SLICKS FROM SYNTHETIC APERTURE RADAR (SAR) IMAGERIES BY AMADI A. SEFAH-TWEREFOUR. Bachelor of Science Undergraduate Dissertation Department of Oceanography and Fisheries University of Ghana, Legon -Ghana. OVERVIEW. Background Synthetic Aperture Radar (SAR) Methodology

E N D
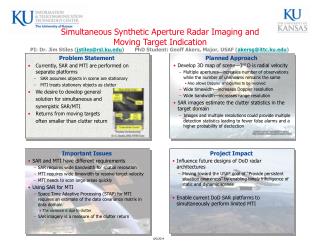
MAPPING OF OIL SLICKS FROM SYNTHETIC APERTURE RADAR (SAR) IMAGERIESBYAMADI A. SEFAH-TWEREFOUR Bachelor of Science Undergraduate Dissertation Department of Oceanography and Fisheries University of Ghana, Legon-Ghana
OVERVIEW • Background • Synthetic Aperture Radar (SAR) • Methodology • Some results Oceanography & Fisheries Department
BACKGROUND Introduction • Increasing energy needs of humans related to increased oil exploration and exploitation • Oil spills originate from rigs and tankers Objective • Develop oil spill detection algorithms for known regions • To develop algorithms for oil spill mapping • Justification • Oil in Ghana • Facilitation of response time to protect coastal resources and ecosystems Oceanography & Fisheries Department
SYNTHETIC APERTURE RADAR (SAR) Why SAR sensors in oil spill monitoring? • Microwave radiation –data capture in cloudy areas • Active sensing • Yet high resolution imageries Mechanism of operation of SAR • Use of back scattering of capillary waves (Bragg scattering mechanism) (Uboupin et al, 2008) • Sea surface roughness responsible for backscattering (Assilzadeh and Gao, 2008) Oceanography & Fisheries Department
METHODOLOGY • MATLAB – Image processing software used • Acquisition and development of new skills Assilzadeh and Gao, 2008 Oceanography & Fisheries Department
SOME RESULTS Original image (s1) Binary image (s1*(m/std)) Binary image (s1>mean(s1)) Plot of s1 Oceanography & Fisheries Department
CHALLENGE • Unavailability of data from the Gulf of Guinea Region • Single spill image from region so far, being used Gulf of Guinea Region Oceanography & Fisheries Department
THANK YOU! Oceanography & Fisheries Department