Download
1 / 7
70 likes | 204 Vues
MASS SPECTROMETRY MATLAB SIMULATION. Ilyana Mushaeva and Amber Moscato Department of Electrical and Computer Engineering Temple University. Cross Correlation Issues. We created the database using matrices, where column 1 is the mass to charge ratio and column 2 is the intensity percentage.

E N D
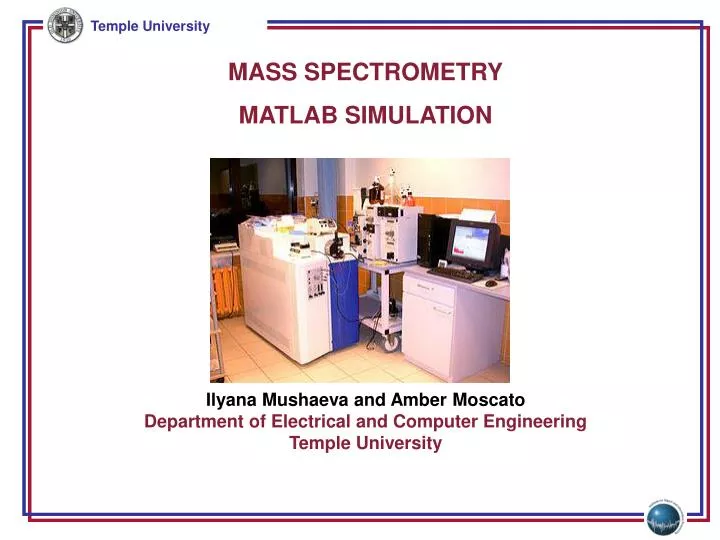
MASS SPECTROMETRY MATLAB SIMULATION IlyanaMushaeva and Amber Moscato Department of Electrical and Computer Engineering Temple University
Cross Correlation Issues • We created the database using matrices, where column 1 is the mass to charge ratio and column 2 is the intensity percentage. • Cross correlation (xcorr2) correlates the entire matrix, and we needed it to correlate specific peaks. • The results were showing us multiple peaks, even though we are only comparing five. • Our variables are discrete in this case, so xcorr functions are unnecessary. • Discovered this method will not work (with this simple simulation), and attempted a different approach. The Resulting Spectrum using this method:
A Possible Resolution? • First, we created an experimental spectrum and a database of theoretical spectra. • Use a distance formula to measure distances between each peak of experimental and database spectra. • The experimental spectrum is compared with a theoretical spectrum by finding the closest distance between the (x,y) pairs, adding the total distance, and comparing, at the end, which gives the least distance overall.
The Protein Database This one is a perfect match. Distance of zero!
Results Using Distance Method • As each spectrum is compared to the experimental,the total distance is calculated by eliminating the pairs and incrementing the distance counter by that value. • The program finds the shortest distance between x and o. • The pdist2 function calculates that distance. • Eliminate the i (experimental) and j (database) variables. • Construct a new matrix with the pairs remaining, and the process continues for the length of matrix (peaks).
Issues and Concerns with Approach • The smallest distance is selected by both the mass to charge ratio and intensity. However, the range on each axis is different. Two points close in m/z value may have an extremely different intensity. Does this matter? • If we create a database with any number of peaks, will the process still work? In each case, we only have 5 peaks, but what if the experimental spectrum has 10 and the database spectra have a range from 10 to 100?
Brief Bibliography • Pascal Wallisch, M. Lusignan, M. Benayoun, T.I. Baker, A.S. Dickey, and N.G. Hatsopoulos. MATLAB for Neuroscientists: An Introduction to Scientific Computing in MATLAB. Elsevier Inc. 2009. • The Math Works. Available at: http://www.mathworks.com/access/helpdesk/help/techdoc/