Download
1 / 11
110 likes | 165 Vues
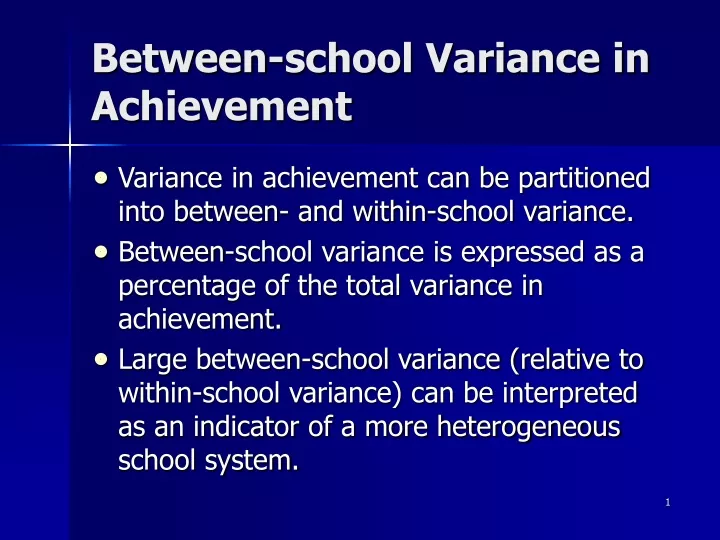
Between-school Variance in Achievement. Variance in achievement can be partitioned into between- and within-school variance. Between-school variance is expressed as a percentage of the total variance in achievement.

E N D
Between-school Variance in Achievement • Variance in achievement can be partitioned into between- and within-school variance. • Between-school variance is expressed as a percentage of the total variance in achievement. • Large between-school variance (relative to within-school variance) can be interpreted as an indicator of a more heterogeneous school system.
Between-school Variance in Reading Literacy (OECD Countries)
School-level score point difference associated with one-unit increase in school mean ESCS
Between-school variance in science explained by ESCS (selected countries)
Explaining Performance in Science – Student-level variables • Gender • Socio-economic status (JC fee-waiver) • Number of books in the home • Home educational resources (more resources better) • Absence from school (frequent absenteeism associated with lower scores) • Grade level (Students in lower grade levels do less well) • Study of science (those who don’t study science do less well)
Conclusion • Relative to other countries, differences in performance between schools in Ireland are moderate. • Nevertheless, there is an association between school-level socioeconomic status and school-level achievement, which is also in the moderate range. • Further, school-level socio-economic status seems to account for the ‘effects’ of other school variables such as school type, school size, and school gender composition.
Conclusion • Variables such as home educational resources, parent-student interaction, attendance at school, engagement in science, extent of bullying, involvement in paid work etc. would seem to be candidates for change. • Care needs to be exercised in interpreting associations between attitudinal variables and achievement, particularly between self-efficacy and science performance.
Conclusion • Associations between curriculum and PISA are worth examining in more detail, particularly in the case of mathematics. • In the case of science, more work is needed in examining the how reading ability interacts with scientific knowledge in explaining performance.
Conclusion • Another issue worth examining in more detail is the performance of students not taking Junior Certificate science vs. those taking Ordinary level. • Finally, differences in knowledge of science among male and female students are worth exploring in greater detail.