Download
1 / 24
240 likes | 409 Vues
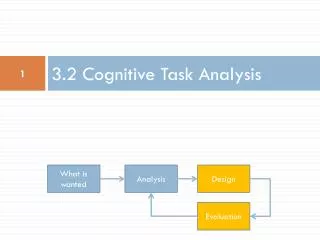
Information Discovery, Analysis, & Interpretation. Lecture 7 Tues 24 Feb 2009. Plan. Pareto Chart PIM. Pareto Analysis. Vilfredo Pareto C19 Italian Economist Investigated distribution of wealth Discovered 80/20 ‘rule’ Pareto Chart Chart based on 80/20 principle*

E N D
Information Discovery, Analysis, & Interpretation Lecture 7 Tues 24 Feb 2009
Plan • Pareto Chart • PIM
Pareto Analysis Vilfredo Pareto • C19 Italian Economist • Investigated distribution of wealth • Discovered 80/20 ‘rule’ Pareto Chart • Chart based on 80/20 principle* • Heuristic i.e. rule of thumb • Prioritisation tool • Separate important few from the ‘trivial many’ *Sometimes 70/30
Problems with Car X in Jan 2009 Which problems should we focus on?
Pareto Chart 80/20 0r 70/30?
Pareto Chart in Excel • Formulas • Autofill • Sum function • Data sorting • Custom Type Charts • Edit Chart: Text Orientation, Scale
Which to act on? • Tally answers from questionnaires? • What are pro’s and con’s of this? Pareto voting • Vote for top 3 problems • Create Pareto Chart • Separate vital few from trivial many • What are pro’s and con’s?
PIM What PIM problems do you have? • Think about work projects, college assignments, personal projects • What PIM tools do you use? • If you were feeling adventurous, what PIM tools could you use? • Would you use a wiki? • Plan PIM strategy for assignment 3. What information will you need to manage? How will you manage it?
Time permitting… Remember EVERYTHING! www.evernote.com Could evernote be a useful PIM tool? HOMEWORK if time doesn’t permit
Homework • TreePad • askSam • MyInfo • ConnectedText • EasyNoter • CUEcards • Onfolio • Paperport • myInfoSafe • OneNote • Debrief • Ultra Recall • myBase • Zoot • The Guide • The Journal • Quosa • NotaBene • KnowledgeWorkshop • WhizFolders • Action Outline • BrainStorm • GoBinder Evaluate 1 PIM software in terms of usefulness to you for next week http://code.google.com/p/kognite/wiki/DocumentManagementSoftware