Download
1 / 31
320 likes | 580 Vues
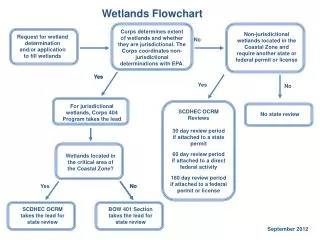
Hydrology Tools For Wetland Determination and Restoration Introduction- Chapter 1. Chapter 19 A Cooperative Effort of. USDA- Natural Resources Conservation Service US Army Corps of Engineers US Environmental Protection Agency US Fish and Wildlife Service. Wetland Hydrology Criteria.

E N D
Hydrology Tools For Wetland DeterminationandRestorationIntroduction- Chapter 1
Chapter 19A Cooperative Effort of USDA- Natural Resources Conservation Service US Army Corps of Engineers US Environmental Protection Agency US Fish and Wildlife Service
Wetland Hydrology Criteria • National Food Security Act ManualUSDA Program ParticipantsAgricultural Land • COE Wetland Delineation ManualAll WetlandsNon-agricultural Land • Must know which criteria to apply to site
WETLAND HYDROLOGY CRITERIA The hydrology criteria used by the USDA is defined by the National Food Security Act Manual (USDA, 1996). The definition is subject to change by lawmakers but at present is as follows: 1. Inundation (flooding or ponding) occurs for 7 consecutive days or longer during the growing season in most years (50% chance or more); or 2. Saturation at or near the surface occurs for 14 consecutive days or longer during the growing season in most years (50% chance or more). Soils may be considered to be saturated to the surface when the water table is within: a. 0.5 ft of the surface for coarse sand, sand, or fine sandy soils; or b. 1.0 ft of the surface for all other soils. (additional criteria for FW, FWP, etc.)
Hydrology Tools - Document Timing, Duration, and Extent of Inundation or Saturation- Are wetland criteria independent - Have been field tested - Accepted by agencies with wetland oversight responsibilities - Support and complement the 87 Manual field indicators of hydrology, does not replace them. - Can be used to evaluate hydroperiod of hydrology restoration projects
Hydrology Tools • Stream and Lake Gage Analysis • Runoff Volumes/Water Balance • Remote Sensing/Aerial Photography • Observation Wells • Scope and Effect Equations • State Drainage Guides • DRAINMOD
Stream Gage Analysis - inundation criteria met by out of bank or backwater flooding from streams, rivers and lakes. - gage data (discharge or stage) establishes the period of time that the water maintains a level that meets the duration (consecutive days) and timing (during growing season) for the required recurrence (50%) can be established. Also determines areal extent (ex. below elevation 92.5) - Interpolation between gages must be used or water surface profile calculations can be used to establish water levels away from a gage. Note: not a 2-yr flood
Day Oct ....... Mar Apr May Jun Jul Aug Sep 1 300 1550 2370 1770 770 206 398 206 2 225 1210 2230 1590 1130 206 571 200 3 250 2100 1900 1130 1230 209 532 190 4 369 2460 1360 673 2840 230 494 192 5 250 2390 854 421 3500 224 500 192 6 160 2060 603 276 3410 224 510 191 7 150 1570 1850 204 3020 229 489 200 8 82 1130 2480 169 2510 238 424 185 9 73 3610 2330 144 1990 243 366 178 10 64 5420 2290 129 1390 246 315 170 11 55 5930 1820 100 790 255 309 164 12 46 6090 1260 92 454 335 290 168 13 46 5970 770 1080 276 504 288 240 14 37 5590 490 1490 190 687 287 280 15 28 5520 454 1340 156 645 291 287 16 10 6120 481 1140 140 603 295 242 17 19 6090 448 822 141 500 320 192 18 28 5760 359 555 152 466 336 157 19 10 5260 275 341 193 437 332 134 20 10 4560 202 214 280 420 314 112 21 19 3750 171 178 299 397 313 124 22 64 2920 166 1090 299 370 2920 210 23 55 2190 163 2110 293 373 277 256 24 28 1330 164 2530 335 428 266 345 25 28 930 247 2640 309 460 250 359 26 19 640 290 2550 256 440 243 306 27 19 553 231 2310 236 408 246 246 28 19 484 350 2010 229 378 256 186 29 19 634 1370 1540 229 359 261 138 30 19 1730 1690 994 229 345 250 102 31 19 2270 638 354 225 Mean 81 .... 3156 989 1041 909 368 425 205 Max 369 .... 6120 2480 2640 3500 687 2920 359 Min 10 .... 484 163 92 140 206 225 102
Water Balance (Checkbook Method) - SPAW computer program available- For depressional areas (prairie potholes, playas)- A water balance can establish the duration, frequency, and depth of ponding (or soil saturation). - The depth-storage relationship of the depression must be known- Variables in the water balance such as rainfall, runoff, stream inflow, outflow, deep percolation, soil moisture storage, and evapotranspiration must be known.- A daily, weekly or monthly balance can be used- A weekly or shorter time frame is preferred for determinations.
Water Balance Use - individual or team will perform the necessary calculation in a region or state - a watershed to depression area ratio is established a) If the ratio is above a determined level, there is sufficient watershed to inundate or saturate the depression to meet wetland hydrology criteria. b) If the ratio is too low, then the hydrology criteria cannot be met. - good for planning/evaluating wetland restoration hydroperiod
Remote Sensing (aerial photographs, satellite imagery) - USDA crop certification aerial photographs Most areas were photographed twice per year.- Photographs represent only a snapshot in time- Supporting information had to be added to the photographs to establish duration and recurrence.- WETS tables provide this information
Remote Sensing Procedure- A minimum of five years of aerial photography with normalprecipitation (determined from the WETS tables) is used. -The occurrence of wetland signatures in this photography is noted. - If wet signatures occur in at least 50% of the years the site is determined to have wetland hydrology.
Scope and Effect Equations - The term "Scope and Effect" is used to describe an analysis of the areal extent and magnitude of the effect of activities such as ditching, tiling, diking, etc. on the site hydrology. - Scope and Effect equations are drainage design equations used to determine whether existing drainage systems (or planned installations or maintenance) are sufficient to remove wetland hydrology (soil saturation) from a site.
An internet site (www.sedlab.olemiss.edu/java/tools.html) - equations are already programmed- the site is interactive so data is input directly and the calculations made without needing to download the programming- the site is fully NETSCAPE 4.0 and IE 3.0 and higher compatible
Observation Wells- Shallow groundwater observation wells (as differentiated from piezometers)- Provide a direct measurement of the depth of the water table, duration, frequency, and timing.- Manual measurements or recording wells can be utilized.- 10 years of measurement is required, using observation well data alone.- Less than 5 years of data can be used if wetland hydrology (water table depth) can be found in years of below or normal precipitation, by using the WETS table information as with the remote sensing procedure .
State Drainage Guides- States drainage guides provide information on the proper drain spacing (both surface and subsurface) to provide adequate drainage for crop production.- Drainage guides establish drainage system spacing requirements based upon the type of system and soil type.- It is reasoned that if a site has a drainage system in proper functioning condition (maintained) that meets the drainage guide criteria, then the hydrology of the site has been removed sufficiently to no longer meet the wetland hydrology criteria.-This reasoning relates to areas affected by water tables, not to those areas subjected to surface inundation by out-of-bank or backwater flooding (ex. Farmed Wetlands).
DRAINMOD- DRAINMOD is a computer program - Developed to simulate the performance of drainage, subirrigation and controlled drainage systems. - DRAINMOD was developed by Dr. R.W. Skaggs of North Carolina State University (NCSU)- DRAINMOD is licensed for use within NRCS.- Others should contact NCSU to obtain the program and to learn about formal training available.
DRAINMOD for wetland determinations- DRAINMOD (Ver 4.60a and higher)- will calculate the number of days during the growing season (user defined) that the water table is within a user defined depth to the surface for each year in the period simulated - this information is used to determine if the site modeled meets the hydrology criteria for duration and depth during the growing season (USDA, 1996).
DRAINMOD USE- used to simulate long-term conditions (ex. 30 years)- requires significant input data (30 years of daily precipitation).- long-term simulation removes the problem of short-term climatic variation (drought, wetness) in the analysis of wetland hydrology.- DRAINMOD does not account for offsite runoff, but this can be accounted for by modifying the precipitation-input data for equivalent runoff.
Summary The Hydrology Tools were developed to provide methodology to establish the timing, duration, and extent of saturation or inundation. Use recorded data or analytical procedures The Hydrology Tools support and complement the field indicators of hydrology. Two or more tools should be used whenever possible.
DISCLAIMER - The Hydrology Tools for Wetland Determination are considered by NRCS to be the practice of engineering.- Individuals outside the NRCS should be cautioned that some states might consider the use of these tools in wetland hydrology determination the practice of engineering.- NRCS provides these tools (hardcopy, internet, etc.) to be utilized by qualified individuals only.
Determination vs. Delineation • What is is difference?
Wetland Delineation • Determinations are made on each of the criteriaindependently. (Does it meet wetland criteria?) • The COE 1987 Manual procedures are used to actually “delineate” the wetland, where all three criteria are met. (Where is the boundary line of the wetland?)
Sources: 1) Smith et al., An Approach for assessing wetland functions using hydrogeomorphic classification, reference wetlands, and functional indices. U.S. Army Corps of Engineers Waterways Experiment Station, Technical Report TR WRP-DE-9. Vicksburg, MS. Oct. 1995. BLH = Bottomland hardwoods, FW = Farmed Wetlands Inundation: flooding or ponding
Sources: 1) Smith et al., An Approach for assessing wetland functions using hydrogeomorphic classification, reference wetlands, and functional indices. U.S. Army Corps of Engineers Waterways Experiment Station, Technical Report TR WRP-DE-9. Vicksburg, MS. Oct. 1995. 2) US Department of Agriculture, Natural Resources Conservation Service. 1997. Hydrology Tools for Wetland Determination, Chapter 19, Engineering Field Handbook. Donald E. Woodward (ed.). USDA, NRCS, Fort Worth, TX. BLH = Bottomland hardwoods, FW = Farmed Wetlands Inundation: flooding or ponding
“The cost of your freedom has already been paid for.” Colonel Charles E. Shelton Freedom Memorial, Owensboro, KY