Download
1 / 33
330 likes | 490 Vues
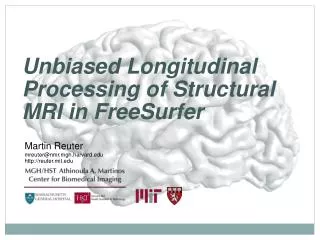
Structural MRI as a Biomarker of Disease Progression in AD. Department of Diagnostic Radiology and MRI Research Lab. Presented by Clifford Jack, M.D. at the November 18, 2002 Peripheral and Central Nervous System Drugs Advisory Committee Meeting.

E N D
Structural MRI as a Biomarker of Disease Progression in AD Department of Diagnostic Radiology and MRI Research Lab Presented by Clifford Jack, M.D. at the November 18, 2002 Peripheral and Central Nervous System Drugs Advisory Committee Meeting
provided a plausible biologic link exists between change in the marker and progression of the disease itself changes in the marker are empirically proven to track with independent measures of progression Indirect measures of disease can be valid biomarkers of progression
Structural MRI (link=cell loss to atrophy) MR Spectroscopy Functional MRI Proton Diffusion Perfusion Relaxometry Magnetization Transfer Amyloid Plaque Imaging Applicable MR Measurements
The Rate of Medial Temporal Lobe Atrophy in Typical Aging and Alzheimer’s Disease Neurology 1998;51:993-999
To determine the annualized rates of volume change of the hippocampus and temporal horn in cognitively normal elderly control subjects and individually matched AD patients To test the hypothesis that these rates were different Objectives
Characterization Of Subjects Controls(n=24) Cases (n=24) Mean ± SD Mean ± SD Age 81.04 ± 3.78 yrs 80.42 ± 4.02 yrs Education 14.75 ± 2.51 yrs 13.21 ± 2.83 yrs MMSE 28.79 ± 1.28 20.74 ± 4.60 DRS 137.38 ± 4.69 108.48 ± 14.35 Interval Between MRI 1.96 ± 0.75 yrs 1.89 ± 0.68 yrs Studies
Controls (n=24) Cases (n-24) P-value* Mean SD Mean SD Hippocampal -1.61.4 -4.01.9 <0.001 Temporal Horn 6.27.69 14.28.5 0.002 *Rank sum test of difference between cases and controls Annual Percent Volume Change
Reasonable 1st step: expected differences in rates between AD and controls were observed, but it did not prove that changes in imaging tracked with changes in independent measures of disease progression Rates were approximately 2.5 times greater in AD than in individually age and gender matched control Conclusion
Rates of Hippocampal Atrophy in Normal Aging, Mild Cognitive Impairment, and Alzheimer's Disease Neurology, 2000;55:484-489
To test the hypothesis that change on imaging (rates of hippocampal atrophy) match clinical change Use clinical transition (or lack of) as gold standard independent measures of progression Objective:Transition Analysis
129 subjects from the ADRC/ADPR who met established criteria for normal controls, mild cognitive impairment (MCI), or probable AD at entry Controls and MCI patients could either remain cognitively stable or could decline MRI at initial & FU clinical assessment Methods
Descriptive Information Age at 1st MMSE Duration between MRI baseline and followup MRI in years Normal-Stable 80.4 ± 6.4 28 ± 1.6 3.0 ± 0.5 (N=48) (62, 97) (23, 30) (2.0, 3.9) Normal-Decliner 82.3 ± 5.8 28 ± 1.7 3.3 ± 0.4 (N=10) (76, 95) (25, 30) (2.7, 4.0) MCI-Stable 77.9 ± 8.0 24 ± 1.9 2.9 ± 0.5 (N=25) (60, 92) (23, 30) (2.1, 4.0) MCI-Decliner 77.3 ± 8.0 24 ± 3.2 2.9 ± 0.6 (N=18) (64, 94) (18, 30) (2.1, 3.9) AD 73.8 ± 11.3 22 ± 4.3 2.9 ± 0.5 (N=28) (51, 93) (14, 29) (2.1, 3.9)
Normal-Stable (N = 48) -1.7 ± 0.9 Normal-Decliner (N = 10) -2.8 ± 1.7 MCI-Stable (N = 25) -2.5 ± 1.5 MCI-Decliner (N = 18) -3.7 ± 1.5 AD (N = 28) -3.5 ± 1.8 PERCENT ANNUAL CHANGE IN HIPPOCAMPAL VOLUME BY FOLLOWUP CLINICAL GROUP Values in table represent mean ± SD (range)
Rates of hippocampal atrophy match the change in cognitive status (or lack of) over time in elderly persons who lie along the cognitive continuum from normal to MCI to AD Validation of change in MRI volume as a biomarker of Dz progression Conclusion
Are some techniques better measures of progression than others at different disease stages? To compare the annualized rates of atrophy by technique among clinical groups (normal -stable, normal-converter, MCI -stable, MCI-converter, AD-slow progressor, and AD-fast progressor) Objective
Hippocampus Entorhinal Cortex (ERC) Whole Brain Ventricle Structures Measured: Rates of Change
Whole Brain Ventricle GROUP Ann% ch GMM GMM HF ERC Normal Stable Mean -0.4 1.8 -1.5 -2.7 Normal Converter Mean -0.7 3.3 -3.1 -5.3 MCI Stable Mean -0.4 2.8 -1.8 -4.8 MCI Converter Mean -0.9 4.0 -4.0 -6.8 AD Slow Progressor Mean -1.3 4.2 -3.5 -7.2 AD Fast Progressor Mean -1.6 6.6 -5.2 -10.2 SDSD 0.8 2.3 3.0 4.7
(Mean1-Mean2) Whole Brain Ventricle (SD1*SD1)+(SD2*SD2) GMM GMM HF ERC Normal Stable vs. 0.37 0.92 0.88 0.83 Normal Converter MCI Stable vs 0.87 0.56 1.00 0.38 MCI Converter AD Slow Progressor vs 0.25 0.72 0.42 0.41 AD Fast Progressor Normal Stable vs 1.32 1.95 1.22 1.52 AD Fast Progressor
Structural MRI rates consistently follow expected correlations with clinical status and clinical transition = support for use as biomarker of Dz progression Appears to be some stage specific Dx sensitivity Conclusions
Milamilene Objective: To assess the technical feasibility of using MRI measurements as a surrogate end point for disease progression in a therapeutic trial of Milamilene for AD Multi-Site Studies
52 week controlled trial of Milameline, a muscarinic receptor agonist, N=450 therapeutic trial itself was not completed MRI arm of the study was continued 192 subjects from 38 different centers underwent 2 MRI with 1 yr interval hippocampal and temporal horn volume Methods
Change from Baseline in Behavioral/Cognitive and MRI Variables Annual Raw Annual % Percent Change Change Decliners (N=192) (N=192) ADAS-Cog 4.1 16.4 65.1 MMSE -1.9 -8.4 65.1 GDS 0 0.0 38.5 Total Hippocampal mm3 -221 -4.9 99.0 Total Temporal Horn Volume mm3 616 16.1 85.4
Per arm for 50% effect size (rate reduction over 1 yr.) ADAS-Cog 320 MMSE 241 hippocampal volume 21 temporal horn volume 54 Power Calculations
Technical feasibility documented Decline over time was more consistently seen with imaging measures than behavioral/cognitive measures (p<0.001) Power calculations: sample sizes imaging<< behavioral/cognitive Conclusions
Structural MRI as a Biomarker In the absence of a positive therapeutic trial that incorporated imaging, the best available evidence supporting the validity of MRI as a biomarker of progression would be multiple natural history studies that consistently demonstrate concordant MRI and clinical changes
R01 AG11378 R01 AG19142 AG16574 ADRC AG06786 ADPR Acknowledgments
Ronald C. Petersen, M.D., Ph.D. Dorla Burton Ruth H. Cha, M.S. Dianne Fitch Peter C. O’Brien, Ph.D. Nancy Haukom Steven D. Edland, Ph.D. Kris Johnson Robert Ivnik Ph.D. Martha Mandarino Glenn E. Smith, Ph.D. Joan McCormick Bradly F. Boeve, M.D. Sheryl Ness Eric G. Tangalos, M.D. Kathy Wytaske David Knopman MD Mayo ADRC and ADPR
MILAMILENE: Parke-Davis M. Slomkowski, Pharm.D. S. Gracon, D.V.M. T. M. Hoover, Ph.D.
Maria Shiung Kejal Kantarci Jeff Gunter Yuecheng Xu Mira Senkacova Kelly Stewart Marina Davtian MR LAB