Download
1 / 56
580 likes | 760 Vues
State of Stormwater Management Practice in Florida. Inter-American Development Bank User Charge Based Funding Mechanisms for Stormwater Management. James D. Hunt, P.E. City of Orlando, Florida Division Manager, Streets & Stormwater Services Division. The Stormwater Balancing Act.

E N D
State of Stormwater Management Practice in Florida Inter-American Development Bank User Charge Based Funding Mechanisms for Stormwater Management James D. Hunt, P.E. City of Orlando, Florida Division Manager, Streets & Stormwater Services Division
The Stormwater Balancing Act cost of stormwater improvements probability of damage occurring
Stormwater Design Hierarchy • Road cross-section: • Catch basin capacity: • Storm sewer design: • Minimum road elev: • Pond design: • Building elevs: • Landlocked ponds: 3-yr storm 5-yr storm 10-yr, 6-hr storm 25-yr, 24-hr storm 25-yr, 24-hr storm 100-yr, 72-hr storm 25-yr, 96-hr storm
Evolution of Stormwater Management • Flood protection (rate controlled) • Flood protection (volume controlled) • Pollution abatement • Wetland preservation & enhancement • Wetland creation • Groundwater issues • Re-use
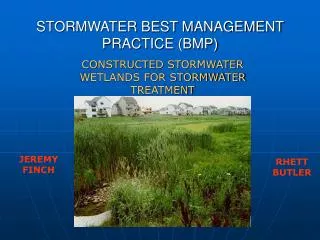
What is a Best Management Practice (BMP)? A cultural or engineering technique, or management strategy, that has been determined and accepted to be an effective and practical means of preventing or reducing non-point source pollution in a local area.
Origins of Pollution Abatement Criteria • 90% of all rainfall events are less than one inch • 80% of rainfall volume is received from events less than one inch in depth • assumes each event completely removes pollutants from drainage catchment and delivers them for treatment
Stormwater Treatment Train Low impact development Roadside swales Inlet filters Baffle boxes End-of-pipe treatment Dry pre-treatment ponds Wet detention ponds Master (regional) facility Wetland filter Close to source Regional system
Low Impact Development • Control occurs closer to source • Reduce maintenance obligations • Still need educational outreach • Still need enforcement • Contrary to compact development? • Cheaper to prevent pollution from entering receiving waters than to remove pollutants from receiving waters
LID Design Features • Vegetative cover • Green roofs • Rain gardens • Roadside swales • Disconnected impervious area • Stormwater reuse
Retention Ponds • Typically dry (may be wet) • Designed to store a specific amount of runoff (usually from the first inch of rainfall in the drainage area) • Will usually return to dry state or designed water elevation through percolation and evaporation in 72 hours
Detention Ponds • Designed to fill up with runoff and then allow the water to pass through the pond at a slow, controlled rate by way of an outfall structure to the receiving water body
Underdrains • Perforated pipe surrounded with filter fabric material and a specific medium (sand or gravel) for percolation • Transports groundwater and percolated stormwater into perforated pipe that discharges into a control structure • Typically installed in poor draining soils and wet areas • Designed to keep ponds dry or at a certain elevation
Wet Detention Pond Design • Greater treatment volume • Slow volume recovery • Littoral shelf with wetland plants • Limited open water • Mean depth three to ten feet • Separation of inlets and outlets for biological contact
Exfiltration • Temporarily hold water in perforated pipes • Allow water to percolate and filter through surrounding soils • Typically installed in parking lots, under garages and other buildings (access for maintenance) • Not appropriate for poorly drained soils or high groundwater conditions • Heavy reliance in a concentrated area can alter groundwater conditions and cause damage
Why Retrofit? • It may be the only way to achieve further water quality improvements • It may be the only cost-effective way to recover diminished capacity in existing stormwater conveyance systems • It’s the right thing to do!
Example #1 • treat runoff from 1 inch of rainfall over project area (100 acres) • 1,000 lbs of pollutants generated • 894 lbs of pollutants are removed • 106 lbs are not removed • an adjacent identical 100-acre tract generates an additional 1,000 lbs of pollutants, for a total of 1,106 lbs
Example #2 • treat half the runoff over twice the area • 2,000 lbs of pollutants generated • 1,530 lbs of pollutants are removed • 470 lbs are not removed
Lake Rowena Screening Facility • Basin 1 area – 539 acres • Pipe Length – 3.45 miles • 75% of pollution to lake is from this one area
Regional Stormwater Management SystemsWhen a Regional Approach is Best • Multiple use objectives • Multi-use can mean multi-funding • Economies of scale • Improve the chance of success
Southeast Lakes BasinCharacteristics • Intensely developed, 3.5 sq mile area • Lowest elevation 58 feet • Much of the basin 65-75 feet • Lowest point on basin rim 103 feet • 18 lakes • Over 60 drainage wells • No outfall to any surface receiving water
Southeast Lakes BasinStrategies to Solve Flooding • Gravity diversion of stormwater away from basin rim • Creation of additional impoundments • Increased storage through lowered regulation schedules • Transfer of surface water from lakes that flood to those requiring augmentation
Greenwood Urban Wetland • Over 75 homes flooded for 3 weeks in 1960 • 2-acre lake expanded to 13 acres • New parkland created • Stormwater re-use employed for irrigating park as well as adjacent cemetery
Lake Lancaster Augmentation Well • Cannot be used if lake is above 68 feet above sea level • Must be turned off once lake reaches 69 feet above sea level • Limited to 114,000,000 gallons per year • Use is prohibited during water emergencies • Has more nutrients than surface water
Lake Lurna-Lake Lancaster Interconnection • Protects Lake Lurna from flooding • Moves excess water to Lake Lancaster for augmentation • Is a cleaner source than groundwater • Mimics natural processes in a landlocked basin • Postpones or eliminates the need for more drainage wells or surface outfall from a large, intensely developed landlocked basin • No guarantee that there will always be enough water for augmentation!
Use of Re-Use Water (Highly Treated Effluent) • Regulatory concerns about impact to surface waters • Other, greater demands for a new resource that cannot meet all demands • The good news: we will be drinking our own wastewater in the future. • The bad news: there won’t be enough to go around!
Lake Fran Flood Control Project • Nearly 2,000 homes removed from 100-year flood plain • 47 acres of wetland preservation • 38 acres of wetland creation • Another 200 acres of wetland mitigation for nearby road project • New school site • Future environmental center • Hub of new park and trail system