Download
1 / 13
130 likes | 308 Vues
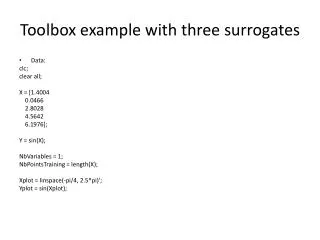
Toolbox example with three surrogates. Data: clc ; clear all; X = [1.4004 0.0466 2.8028 4.5642 6.1976]; Y = sin(X); NbVariables = 1; NbPointsTraining = length(X); Xplot = linspace (-pi/4, 2.5*pi)'; Yplot = sin( Xplot );. Fitting of cubic polynomial.

E N D
Toolbox example with three surrogates • Data: clc; clear all; X = [1.4004 0.0466 2.8028 4.5642 6.1976]; Y = sin(X); NbVariables = 1; NbPointsTraining = length(X); Xplot= linspace(-pi/4, 2.5*pi)'; Yplot = sin(Xplot);
Fitting of cubic polynomial % polynomial response surface PRSdegree = 3; PRSRegression = ‘Full’; • optPRS = srgtsPRSSetOptions(X, Y, PRSdegree, PRSRegression); [srgtPRS] = srgtsPRSFit(optPRS);
Fitting the Kriging surrogate % kriging Theta0 = 0.01*(NbPointsTraining^(2/NbVariables))*ones(1,NbVariables); LowerBound= 1e-3*ones(1,NbVariables) >>LowerBound = 1.0000e-003 UpperBound = 3*Theta0 >>UpperBound = 0.7500 KRG_RegressionModel = @dace_regpoly0; KRG_CorrelationModel = @dace_corrgauss; KRG_Theta0 = Theta0; KRG_LowerBound = LowerBound; KRG_UpperBound = UpperBound; optKRG= srgtsKRGSetOptions(X, Y, KRG_RegressionModel, ... KRG_CorrelationModel, KRG_Theta0, KRG_LowerBound, KRG_UpperBound); [srgtKRG, sttKRG] = srgtsKRGFit(optKRG);
Fitting the radial basis function % radial basis neural network RBNN_Goal = 1e-3 RBNN_Spread = 2 RBNN_MN = 3 RBNN_DF = 1; optRBNN =srgtsRBNNSetOptions(X, Y, ... RBNN_Goal, RBNN_Spread,RBNN_MN, RBNN_DF) [srgtRBNN] =srgtsRBNNFit(optRBNN)
Predictions at test points [YhatPRSPredVarPRS] = srgtsPRSPredictor(Xplot, X,srgtPRS); [YhatKRGPredVarKRG] = srgtsKRGPredictor(Xplot, srgtKRG); YhatRBNN = srgtsRBNNEvaluate(Xplot, srgtRBNN); figure(1); clf(1); plot(Xplot, Yplot, ... Xplot, YhatPRS, ... Xplot, YhatKRG, ... Xplot, YhatRBNN, ... X, Y, 'o'); grid legend('sin(x)',... 'PRS',... 'KRG',... 'RBNN',... 'data', ... 'Location', ‘NW'); xlabel('x');
Prediction variance figure(2); clf(2); plot(Xplot, PredVarPRS, ... Xplot, PredVarKRG, ... X, zeros(NbPointsTraining, 1), 'o'); grid legend('PredVarPRS',... 'PredVarKRG',... 'data', ... 'Location', 'SW'); xlabel('x');
Increasing the bounds for the kriging theta • UpperBound = 30*Theta0
Which surrogate is the best? • Many papers have been written comparing surrogates for a single or group of problems to claim that a particular surrogate is superior. • As we will see, there is no surrogate that is superior for most problems. • When authors compare surrogates for test problems, they often can afford dense grid for testing. • When we need to choose one for a particular problem, cross validation error is our best bet. • There are other error metrics that are based on assumptions linked to a given surrogate, but they are not good for comparing surrogates of different types.
Recent study on cross validation error • F.A.C. Viana, R.T. Haftka, and V. Steffen Jr, "Multiple surrogates: how cross-validation errors can help us to obtain the best predictor," Structural and Multidisciplinary Optimization, Vol. 39 (4), pp. 439-457, 2009 • Test a series of problems with 24 surrogates, with different designs of experiments.
. .
Conclusions • Cross validation is useful to identify top group of surrogates for given design of experiments. • Changing the number of points or even the design of experiments can change the ranking of the surrogates. • For many industrial problems, fitting surrogates and using them to optimize is much cheaper than generating data points. • It makes sense then to use several surrogates, not just one!