Download
1 / 22
220 likes | 381 Vues
Visual Analytics with Linked Open Data and Social Media for e-Governance. Vitaveska Lanfranchi Suvodeep Mazumdar Tomi Kauppinen Anna Lisa Gentile Updated material will be available at http :// linkedscience.org /events/vislod2014/. #VISLOD_ESWC2014. Outline. Agenda Introductions

E N D
Visual Analytics with Linked Open Data and Social Media for e-Governance VitaveskaLanfranchi Suvodeep Mazumdar TomiKauppinen Anna Lisa Gentile Updated material will be available at http://linkedscience.org/events/vislod2014/ #VISLOD_ESWC2014
Outline • Agenda • Introductions • Overview • What is Visual Analytics? • What is Social Media? • How is it used for e-Governance? • Social Media Access and Processing • Visual Analytics Techniques • Wrap up and questions
The Information Space • The size of the ‘digital universe’ in 2010 surpassed one ZB • About 70% of this information is generated by individuals • Ubiquitous Computing • Smartphones • Tablets • 24/7 Connectivity • This trend has driven, and been driven by, the dramatic rise of content sharing and social media platforms
Online Activities 1 out of 5 online minutes are spent on social networks
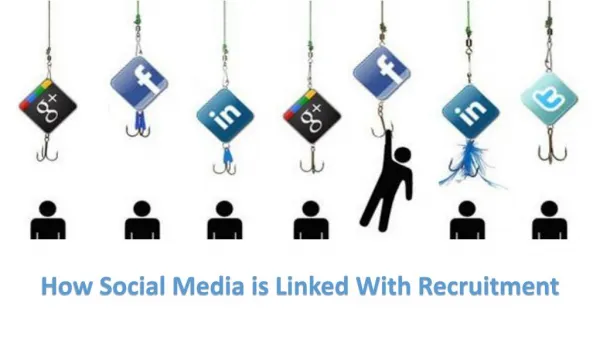
How can Social Media help? • Real-time communication between citizens • Alerting friends, relatives • Alerting authorities • Providing advice, help, support • Real-time communication from authorities • Alerting population • Contacting people • Providing advice, help, support • Constant monitoring of social media to spot and follow emerging situations • Supporting all the phases of an emergency
A few examples • In 2011 Japan and US earthquakes • more than 40K related tweets were sent within the first minute peaking at about 5,500 tweets per second • During the East Coast US earthquake the first tweet after 24 seconds
Social Media Data - Key Features • Massive, real-time data • Numerous and Diverse Data Source • High noise to signal ratio • Semantic Underspecification • High multimediality • 30% of Twitter posts contain images or links
Some Definitions “Visual analytics is more than just visualization and can rather be seen as an integrated approach combining visualization, human factors and data analysis”[Keim et al, 2006] “Visual Analytics is the science of analytical reasoning facilitated by interactive visual interfaces”[Thomas and Cook, 2005] “Visual analytics is the formation of abstract visual metaphors in combination with a human information discourse (usually some form of interaction) that enables detection of the expected and discovery of the unexpected within massive, dynamically changing information spaces” [Cook, 2007]
Challenges for e-Governance • Information Overload • Scalability: • Information availability • Visual display • Multimodality • Information manipulation • Focus without loss
Aims • facilitate analytical reasoning: • data → information → knowledge →explanation • detect the expected and discover the unexpected • provide understandable assessments • communicate assessments • effectively • Information, knowledge, and reasoning • must be made explicit
What is needed • Knowledge Capture • Knowledge Representation • Knowledge Integration
VA - Multidimensional displays Different colors and size circles display different data dimensions
VA - Interactive displays Users can interact and manipulate data