Download
1 / 59
1.55k likes | 4.08k Vues
Catering Menu Pricing and Controls. CM226 Catering and Event Management Chapter 7, pages 156 – 184. CHAPTER OBJECTIVES. Explain the requirements of effective and accurate menu pricing. 2. Discuss the formulas for calculating costs, breakeven points, and profits.

E N D
Catering Menu Pricing and Controls CM226 Catering and Event Management Chapter 7, pages 156 – 184
CHAPTER OBJECTIVES • Explain the requirements of effective and accurate menu pricing. • 2. Discuss the formulas for calculating costs, breakeven points, and profits. • 3. Explain revenue management practices.
1. Cost and Profit. The four major categories of cost: • Food and beverage costs: The cost of all food-related purchases required to produce completed menu items. • Labor costs: The costs associated with labor, including benefits, taxes, wages, meals, and uniforms.
Overhead costs: The costs of operating the business. To these three costs can be added profit: • Profit: funds remaining after all costs have been paid from revenues.
What is break even? • The amount of sales, costs and price at which there is neither a loss nor a gain in business. Another way to put it is: Break-Even is the volume where all fixed expenses are covered. • The key to Break Even is PRICE. You must ask the question…At what price will I break even? Make a profit?
Why is Break Even Important? • “Rita”, a graduate, has a business making pillows, bed coverings and linens. • A famous business woman became interested in the products and, over time, they struck up a deal to sell pillows in a famous catalog. • Rita sold the pillows for $60 to this famous person’s business. • However, after doing Break Even with the help, Rita discovered it cost her $54 to manufacture each pillow.
Why is Break Even Important? • Rita’s gross profit was $6.00 or 10% of the selling price. • 10% of the selling price will go to paying for overhead or indirect costs or Fixed Cost. • Since she did not perform a Break Even Analysis, Rita was surprised to see that she was actually losing money. • Offering the pillows at the low $60 price, Rita is only covering her direct cost and barely covering her indirect cost.
Key Terms used in Break-Even Analysis: • Fixed Cost • Variable Unit Cost • Unite Price • Expected Unit Sales • Unit Price • Total Variable Costs • Total Costs • Total Revenue • Profit (or Loss) • Break-Even
Key Terms • Fixed Cost:The sum of all costs required to produce the first unit of a product. This amount does not vary as production increases or decreases, until new capital expenditures are needed. • Variable Unit Cost:Costs that vary directly with the production of one additional unit.
Fixed Costs • Are those costs that remain constant regardless of the volume of business. • The costs you must cover whether you make a sale or not. • Examples include: • Rent • Insurance • Debt Service on Equipment
Variable costs • Are those costs associated with the volume of business and are flexible. • Examples include: • Labor (mixed as it is both fixed and variable) • Linen • Paper Goods • Food product
Total Costs • Together, the Fixed cost plus the Variable Costs equal TOTAL Costs.
Key Terms (continued) • Expected Unit Sales:Number of units of the product projected to be sold over a specific period of time. • Unit Price:The amount of money charged to the customer for each unit of a product or service.
Key Terms (continued) • Total Variable Cost:The product of expected unit sales and variable unit cost. • (Expected Unit Sales * Variable Unit Cost) • Total Cost:The sum of the fixed cost and total variable cost for any given level of production. • (Fixed Cost + Total Variable Cost)
Key Terms (continued) • Total Revenue:The product of expected unit sales and unit price. • Expected Unit Sales * Unit Price • Profit (or Loss):The monetary gain (or loss) resulting from revenues after subtracting all associated costs. • Total Revenue - Total Costs
Key Terms (continued) • Break Even:Number of units that must be sold in order to produce a profit of zero (but will recover all associated costs). • Break Even = FC / (Unit Price –VC per Unit
2. Breakeven Analysis • A method of identifying how much revenue must be generated before an operation begins to make a profit.
Cost/Volume/Profit Analysis • Each foodservice operator knows that some accounting periods are more profitable than others. • A Cost/Volume/Profit Analysis can help managers predict and plan for profitability. • At the Break-Even point, operational expenses are exactly equal to sales revenue.
Cost/Volume/Profit Analysis Cost/Volume/Profit Graph y axis Total Revenues Profits Total Costs Dollars Losses Break-Even point 0 Number of Covers x axis
Why it is important to understand your Break-Even point? • Breakeven analysis gives you insight to the effects of important business decisions like: • Will it be profitable to market a product or service? • What prices will you need to charge for your product or service? • How many units should you produce?
Why it is important to understand your Break-Even point? • What is the financial attractiveness of different strategic options for your business, such as expanding operations or hiring new employees? • How can you do a better job of handling cash flow evenly?
Why it is important to understand your Break-Even point? • Break-Even analysis is a tool to calculate at which sales volume the variable and fixed costs of producing your product will be recovered. • Another way to look at it is that the Break-Even point is the point at which your product stops costing you money to produce and sell, and starts to generate a profit for your company.
Why it is important to understand your Break-Even point? • You can also use Break-Even analysis to solve managerial problems: • setting price levels • targeting optimal variable/ fixed cost combinations • determining the financial attractiveness of different strategic options for your company
Break-Even analysis depends on the following variables: • The fixed production costs for a product. • The variable production costs for a product. • The product's unit price. • The product's expected unit sales [sometimes called projected sales.]
What is break even? • The amount of sales, costs and price at which there is neither a loss nor a gain in business. Another way to put it is: Break-Even is the volume where all fixed expenses are covered. • The key to Break Even is PRICE. You must ask the question…At what price will I break even? Make a profit?
You can also use break even analysis to solve managerial problems: • setting price levels • targeting optimal variable/ fixed cost combinations • determining the financial attractiveness of different strategic options for your company
The Break-Even point is the point where Total Contribution = Total Fixed Cost • At THIS point, • There is no profit, and • There is no loss
Development of a Break-Even Graph • The following graphs illustrate how one builds a Break-Even chart. • This company has annual fixed costs of $40, a unit selling price of $10, and a unit variable cost of $6. Since it earns $4 from each unit that it sells for $10, the company has a margin percentage of 40% of sales
Fixed Costs • First, one draws the fixed cost line on a graph. A flat line at the $40 level represents fixed costs.
Variable Costs • Next we show the variable cost line in this graph.
Variable Costs • Adding the variable costs to the fixed costs provides the total costs. • In Break-Even and cost-volume-profit analysis accountants assume all costs are either fixed or variable.
Revenue Line • This line enables one to identify the Break-Even point, the point at which the total revenue line crosses the total cost line.
Profit Graphs • Because the Break-Even chart has so many lines it can be confusing to read. • Accordingly, accountants have developed the Profit Graph to show the same information but with fewer lines.
Profit Graphs (continued) • The profit graph below shows the same information as the Break-Even chart.
2. Breakeven Analysis • The breakeven point: the point at which revenue has covered costs and can become profit. • Calculated by dividing the contribution rate into the total of fixed costs.
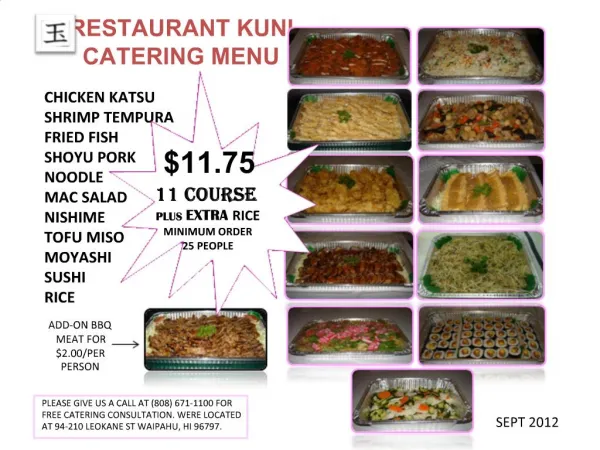
3. Menu Pricing • Fixed price, or table d’hote • Caterers traditionally rely on fixed price menus to control costs, production, service, and profit. • Requires that operators consider how to establish a selling price and still maintain a profitable overall food cost percentage.
3. Menu Pricing • Individual menu items can be changed without affecting the food cost percentage and selling price. • Mixed pricing, or semi a la carte • The customer is offered a set price menu with the option of changing some courses for an additional charge per person.
3. Menu Pricing • Individual course pricing, or a la carte • Offers every course item on the menu for a separate per-person price. • Requires guidance from the catering sales staff to help guests develop menus whose combinations of food items are appropriate as well as work-able from the standpoint of production.
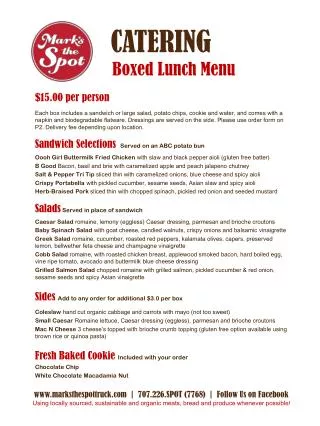
4. Price Range. • Catering menus should be established within a range of no more than $12 to $15. • By providing a limited price range, customers can be comfortable about their decision without feeling either extravagant or cheap.
5. Catering Pricing Methods. • Actual cost method • Applied where the selling price is established before the cost of food is calculated. • Determines the percentage that each of the four price components represents based on costs currently incurred by the foodservice business and an established profit percentage goal.
5. Catering Pricing Methods. • Food cost percentage method • Method used most frequently in restaurant operations to price individual menu items. • Determines what the selling price should be based on a known food cost percentage.
5. Catering Pricing Methods. • Two of the following three factors must be known in order to apply the food cost percentage to menu pricing: • Food cost Percentage • Cost of Food (COGS F) • Selling Price • The food cost percentage method consists of three pricing formulas, one for determining each unknown factor.
The Formulas and their Abbreviations are as follows: 1.) food cost / food-cost % = Selling Price FC / FC% = SP 2.) food cost / selling price = food-cost % FC / SP = FC% 3.) selling price x food-cost % = food cost SP x FC% = FC
5. Catering Pricing Methods. • Factor pricing • Establishes a factor that represents the food cost percentage. • Explain the factor pricing formula.
Factor Pricing • The Factor Pricing method establishes a factor that represents the food-cost percentage. • The factor is based on the number of times the percentage can be divided into 100: 100% / 40% = 2.5
Factor Method • This factor is multiplied by the food cost to calculate the selling price: $3.35 (food cost) x 2.5 (factor) = $8.37 • Management can apply the factors for the food-cost percentages most commonly used in their operation to quickly calculate selling prices.
5. Catering Pricing Methods. • Food cost percentage method • Method used most frequently in restaurant operations to price individual menu items. • Determines what the selling price should be based on a known food cost percentage.