Download
1 / 23
230 likes | 364 Vues
Revised estimates of human cochlear tuning from otoacoustic and behavioral measurements. Christopher A. Shera, John J. Guinan, Jr., and Andrew J. Oxenham. Background. Key characteristic of hearing: frequency tuning of cochlear filters Sensory cells respond to a preferred range of energy

E N D
Revised estimates of human cochlear tuning from otoacoustic and behavioral measurements Christopher A. Shera, John J. Guinan, Jr., and Andrew J. Oxenham
Background • Key characteristic of hearing: frequency tuning of cochlear filters • Sensory cells respond to a preferred range of energy • Filter bandwidth 1/ sharpness of tuning
Background Assessments of cochlear tuning • Non-human mammals • ANF recordings in live anesthetized animals • Humans • Psychophysical measures • Masking procedures • Pure tone detection in background noise
Downfalls • Humans • Psychophysical measures • Masking procedures • Pure tone detection in background noise • Assumptions underlying pure tone detection method are uncertain • Physcophysical detection tasks depend on filter characteristics as well as neural processing • No way to validate behavioral measures in humans • Authors believe that human cochlear tuning has been underestimated
Aims • Compare current measures of human cochlear tuning with animal measures • Develop a noninvasive measure of cochlear tuning based on otoacoustic emissions • Test correspondence between physiological and behavioral measures of frequency selectivity
Aims • Compare current measures of human cochlear tuning with animal measures • Develop a noninvasive measure of cochlear tuning based on otoacoustic emissions • Test correspondence between physiological and behavioral measures of frequency selectivity
Masker Signal Auditory filter Level (dB SPL) Frequency 2 kHz Determination of bandwidth QERB • Measure of “sharpness” of tuning based on critical bandwidth • QERB(CF) = CF/ERB(CF) Smaller bandwidth = higher QERB
Results Genuine species differences or erroneous human data?
Aims • Compare current measures of human cochlear tuning with animal measures • Develop a noninvasive measure of cochlear tuning based on otoacoustic emissions • Test correspondence between physiological and behavioral measures of frequency selectivity
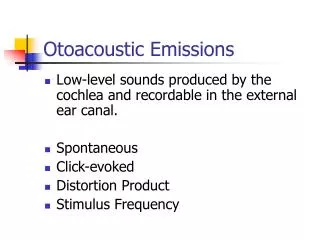
Experiment II • Subjects • Guinea pigs (n=9) • Cats (n=7) • Humans (n=9) • Measure stimulus-frequency otoacoustic emissions (SFOAEs) • Cochlear traveling waves scattered by the mechanical properties of the cochlea • Recordable sounds emitted from the ear • Evoked by a pure tone • Calculate SFOAE group delays (NSFOAE) • Negative of slope of emission-phase vs frequency
Theory • NSFOAE = 2(NBM) Normalized emitted wave delay is double the normalized BM transfer function delay • NBM= delay of BM transfer function • NSFOAE = emission group delay Can use measurable NSFOAE group delays to estimate NBM
Theory II • At low levels, smaller bandwidths (larger QERB) correspond to steeper phase slopes (longer delays) • BM tuning at low levels nearly identical to ANF tuning so: QERB NBM ==> QERB = kNBM Where k is a measure of filter shape
Application • Use measurable SFOAE emissions to estimate NBM • Use NBM to estimate QERB using known k values from other species
If this is right, it suggests: Human k is a factor of 3 larger than in animals Human QERB is very different from cats and guinea pigs
If this is right, it suggests: Previous measures underestimate human filter “sharpness” Such sharp tuning may facilitate speech communication
Aims • Compare current measures of human cochlear tuning with animal measures • Develop a noninvasive measure of cochlear tuning based on otoacoustic emissions • Test correspondence between physiological and behavioral measures of frequency selectivity
Experiment III • 8 Normal-hearing humans • Detection of a sinusoidal signal • 10dB above threshold in quiet • Frequencies: 1,2,4,6,8 kHz • 5ms after offset of burst of masker • Frequencies: 2 .25f wide spectral bands of Gaussian noise placed 0, 0.1, 0.2, 0.3, 0.4 f below signal frequency • gated by 5ms raised-cosine ramps • Measured thresholds using 3-alternative forced-choice procedure • Use mean data to derive cochlear filter magnitude responses
Reasoning behind methodology • Use low, near threshold tuning curves • Avoid compression & non-linear affects • Noise masker extends spectrally above and below signal frequency • avoid off-frequency listening • avoid confusion between masker & signal • Non-simultaneous masking • Minimize suppressive interactions between masker and signal • Constant signal level (instead of masker level) • paradigm used in neural threshold measurements
Conclusions • Human cochlear filters are substantially sharper than commonly believed • Contrary to prior beliefs • Human Q filters are not constant above 500Hz • Human tuning may be sharper than cat • Human and cat tuning may vary similarly with CF • Supports the assumption that k is invariant across species • Suggests revised understanding of the cochlear frequency-position map