Download
1 / 44
440 likes | 444 Vues
Using NASA’s Giovanni Web Portal to Access and Visualize Satellite-Based Earth Science Data in the Classroom. Dr. Steven A. Lloyd Chief Scientist NASA Goddard Earth Sciences Data and Information Services Center (GES DISC) Teaching With New Geoscience Tools:

E N D
Using NASA’s GiovanniWeb Portal to Access and Visualize Satellite-Based Earth Science Data in the Classroom Dr. Steven A. Lloyd Chief Scientist NASA Goddard Earth Sciences Data and Information Services Center (GES DISC) Teaching With New Geoscience Tools: Visualizations, Models and Online Data Amherst, MA 10-12 February 2008
GES-DISC Interactive Online Visualization and Analysis Infrastructure(Giovanni) • With Giovanni and a few mouse clicks, one can easily obtain information on the atmosphere around the world. • There is no need to learn data formats to retrieve and process data. • You can try various combinations of parameters measured by different instruments. • All the statistical analysis is done via a regular web browser. • http://giovanni.gsfc.nasa.gov/ • Caution: Giovanni is a constantly evolviong data exploration tool! Teaching With New Geoscience Tools Workshop
CloudSat CALIOP CALIPSO What is Giovanni? Data Inputs MLS Aura Area Plot Time Series Model Output OMI Aura AIRS Aqua MODIS Aqua MODIS Terra Giovanni Instances C A B SeaWiFS TRMM B A HALOE UARS C E C TOMS EP, N7 F D AMSR-E Aqua F E D MISR Terra Correlations Column Densities Profile Cross-Section Teaching With New Geoscience Tools Workshop
Giovanni capabilities Basic (one-parameter): • Area plot – averaged or accumulated over any data period for any rectangular area (various map projections) • Time plot – time series averaged over any rectangular area • Hovmoller plots –longitude-time or latitude-time cross sections • ASCII output – for all plot types (can be used with GIS apps, spreadsheets, etc.) • Image animation – for area plot • Verticalprofiles • Vertical cross-sections, zonal means Beyond basics: • Area plot - geographical intercomparison between two parameters • Time plot - an X-Y time series plot of several parameters • Scatter plot of parameters in selected area and time period • Scatter plot of area averaged parameters - regional (i.e., spatially averaged) relationship between two parameters • Temporal correlation map - relationship between two parameters at each grid point in the selected spatial area • Temporal correlation of area averaged parameters - a single value of the correlation coefficient of a pair of selected parameters • Difference plots • Anomaly plots • Acquiring parameter and spatial subsets in a batch mode through Giovanni Teaching With New Geoscience Tools Workshop
http://disc.gsfc.nasa.gov/techlab/giovanni Teaching With New Geoscience Tools Workshop
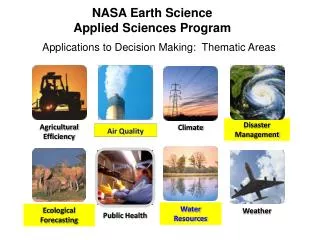
Science Questions You will need to identify which specific data products can address your science question. Data Products Satellite Data in Giovanni Data within GES DISC (Archive) All Satellite Remote Sensing Data Teaching With New Geoscience Tools Workshop
NASA Earth-Observing Satellites North Pole (hidden) Direction of Earth’s Rotation Path of Satellite Plane of Equator Sun-Synchronous, Near-Polar, Low-Earth Orbit (LEO) NASA’s “Big Blue Marble” Photograph taken from Apollo 17 7 December 1972 South Pole 7
NASA Earth-Observing Satellites Low Earth Orbit (LEO): Orbiting at an altitude of 600-1,000 km. Path of Satellite 8
NASA Earth-Observing Satellites Low Earth Orbit: Orbiting at an altitude of 600-1,000 km. Path of Satellite Ascending Orbit: The satellite is moving South to North when that portion of the orbit track crosses the equator. 9
NASA Earth-Observing Satellites Low Earth Orbit: Orbiting at an altitude of 600-1,000 km. Ascending Orbit: The satellite is moving South to North when that portion of the orbit track crosses the equator. Descending Orbit: The satellite is moving North to South when that portion of the orbit track crosses the equator. 10
NASA Earth-Observing Satellites Low Earth Orbit: Orbiting at an altitude of 600-1,000 km. Ascending Orbit: The satellite is moving South to North when that portion of the orbit track crosses the equator. Descending Orbit: The satellite is moving North to South when that portion of the orbit track crosses the equator. Ascending vs. descending orbits are like night and day! 11
NASA Earth-Observing Satellites Low Earth Orbit: Orbiting at an altitude of 600-1,000 km. Ascending Orbit: The satellite is moving South to North when that portion of the orbit track crosses the equator. Sun-Synchronous: The satellite is always in the same relative position between the Earth and Sun. Descending Orbit: The satellite is moving North to South when that portion of the orbit track crosses the equator. 12
NASA Earth-Observing Satellites Low Earth Orbit: Orbiting at an altitude of 600-1,000 km. Ascending Orbit: The satellite is moving South to North when that portion of the orbit track crosses the equator. Period: A typical polar, Sun-synchronous LEO satellite takes about 90 minutes to completely circle the Earth. This gives it about 16 orbits per day. Descending Orbit: The satellite is moving North to South when that portion of the orbit track crosses the equator. Sun-Synchronous: The satellite is always in the same relative position between the Earth and Sun. 13
NASA Earth-Observing Satellites Low Earth Orbit: Orbiting at an altitude of 600-1,000 km. Ascending Orbit: The satellite is moving South to North when that portion of the orbit track crosses the equator. Equator-Crossing Time: The local apparent solar time when the satellite crosses the equator. Example: Terra has an equator crossing time of 10:30 am, and is called an “AM” or morning satellite. Period: A typical polar, Sun-synchronous LEO satellite takes about 90 minutes to completely circle the Earth. This gives it about 16 orbits per day. Descending Orbit: The satellite is moving North to South when that portion of the orbit track crosses the equator. Sun-Synchronous: The satellite is always in the same relative position between the Earth and Sun. 14
NASA Earth-Observing Satellites Low Earth Orbit: Orbiting at an altitude of 600-1,000 km. Ascending Orbit: The satellite is moving South to North when that portion of the orbit track crosses the equator. Equator-Crossing Time: The local apparent solar time when the satellite crosses the equator. Example: Terra has an equator crossing time of 10:30 am, and is called an “AM” or morning satellite. Period: A typical polar, Sun-synchronous LEO satellite takes about 90 minutes to completely circle the Earth. This gives it about 16 orbits per day. Descending Orbit: The satellite is moving North to South when that portion of the orbit track crosses the equator. Sun-Synchronous: The satellite is always in the same relative position between the Earth and Sun. Inclination: The position of the orbital plane relative to the equator. For near-polar orbits, typically about 97º. 15
Satellite Inclination Low Inclination Orbit (often near 57º-- Space Shuttle) no polar coverage High Inclination or Polar Orbit (near 90º) virtually complete global coverage Equator Inclination: The position of the orbital plane relative to the equator. For near-polar orbits, typically about 97º. 16
Satellite Viewing Geometry Nadir Solar Zenith Angle Elevation Angle Zenith Horizon 17
Satellite Viewing Geometry Direction of Satellite Motion Push-Broom Cross-Track Scanning 18
Satellite Viewing Geometry Cross-track scanning results in individual observations (“pixels”) of varying size, and can leave gaps between successive orbits if the scan angle is not wide enough. 19
Aqua Terra CALIPSO NASA Earth-Observing Satellites UARS Nimbus-7 SORCE TRMM Earth Probe Aura CloudSAT SeaWIFS 20
NASA’s A-Train: A Constellation of Near-Simultaneous Afternoon-Viewing Satellites CALIPSO 1:31:15 CloudSat 1:31 OCO 1:15 (2009 launch) Parasol 1:33 (ESA) Aqua 1:30 Aura 1:38 21
Near-Coincident A-Train Observations • Modis (Aqua) • AIRS (Aqua) • CloudSat • Calipso • OMI (Aura) Teaching With New Geoscience Tools Workshop
Scientific Instruments on NASA Satellites TRMM: Tropical Rainfall Measuring Mission • Data Products at GES DISC: • 3-hourly, daily and monthly rainfall • Surface rainfall rate • Accumulated rainfall • Latent heating • Cloud liquid water content • Cloud ice content • Instruments: • Precipitation Radar (PR) • TRMM Microwave Imager (TMI) • Visible and InfraRed Scanner (VIRS) • Cloud and Earth Radiant Energy Sensor (CERES) • Lightning Imaging Sensor in cooperation with: 23
Scientific Instruments on NASA Satellites SORCE: Solar Radiation and Climate Experiment • Instruments: • Total Irradiance Monitor (TIM) • Solar Stellar Irradiance Comparison Experiment (SOLSTICE) • Spectral Irradiance Monitor (SIM) • XUV Photometer System (XPS) • Data Products at GES DISC: • Daily spectral solar irradiance • 6-hr and daily total solar irradiance 24
Scientific Instruments on NASA Satellites EOS Terra • Data Products at GES DISC: • Aerosol optical depths • Cloud fraction • Cloud top pressure • Aerosol parameters • Water vapor • Cirrus cloud reflectance • etc. • Instruments: • Adv. Spaceborne Thermal Emission and Reflection Radiometer (ASTER) • Moderate Resolution Imaging Spectroradiometer (MODIS) • Multi-angle Imaging SpectroRadiometer (MISR) • Measurement of Pollution • In The Troposphere (MOPITT) • Cloud and Earth Radiant Energy Sensor (CERES) 25
Scientific Instruments on NASA Satellites • Data Products at GES DISC: • Aerosol optical depths • Cloud fraction • Cloud top pressure • Aerosol parameters • Water vapor • Cirrus cloud reflectance • Surface pressure • Temperature profiles • H2O and O3 profiles EOS Aqua • Instruments: • Atmospheric Infrared Sounder (AIRS) • Advanced Microwave Sounding Unit (AMSU-A) • Humidity Sounder for Brazil (HSB) • Advanced Microwave Scanning Radiometer for EOS (AMSR-E) • Moderate-Resolution Imaging Spectro- radiometer (MODIS) • Clouds and the Earth's Radiant Energy System (CERES) 26
Scientific Instruments on NASA Satellites EOS Aura • Data Products at GES DISC: • Atmospheric profiles of H2O, O3, CO, ClO, HCl, HCN, OH and HNO3 • Temperature profiles • Geopotential height • Total column O3 and NO2 • Aerosol index • Cloud reflectivity • Surface UV irradiance • Instruments: • High Resolution Dynamic Limb Sounder (HIRDLS) • Microwave Limb Sounder (MLS) • Ozone Monitoring Instrument (OMI) • Tropospheric Emission Spectrometer (TES) 27
Nimbus-7 Total Ozone Mapping Spectrometer (TOMS)Earth Probe Total Ozone Mapping Spectrometer (TOMS) Aura Ozone Monitoring Instrument (OMI) EOS Aura Nimbus-7 Earth Probe Global View North Polar View South Polar View 29 September 1997 Teaching With New Geoscience Tools Workshop
2007 Antarctic Ozone Hole • Orientation • Size • Shape • Collar • Polar Vortex • Wind Speed • Discontinuity • “Polar Blank” 26 September 2007 Teaching With New Geoscience Tools Workshop
TOMS Total Ozone October Monthly Averages Teaching With New Geoscience Tools Workshop
UV Effective Reflectivity UV Aerosol Index Noon-time Erythemal UV Irradiance Other Useful TOMS/OMI Data Products 29 September 1997 Teaching With New Geoscience Tools Workshop
Southern California Wildfires 25 October 2007 Aerosol Optical Depths at 0.55 µm (550 nm- red) from the MODIS instrument on the Terra satellite Teaching With New Geoscience Tools Workshop
Southern California Wildfires 25 October 2007 MODIS on Terra ~10:30 am MODIS on Aqua ~1:30 pm Aerosol Optical Depths at 0.55 µm (550 nm- red) Teaching With New Geoscience Tools Workshop
Southern California Wildfires 25 October 2007 OMI UV Aerosol Index on Aura ~1:38 pm MODIS on Terra ~10:30 am MODIS on Aqua, ~1:30 pm Teaching With New Geoscience Tools Workshop
Southern California Wildfires 23-27 October 2007 Multi-day means “smear out” some spatial features, but allow for more complete coverage for data-sparse mapping OMI UV Aerosol Index OMI Tropospheric NO2 Teaching With New Geoscience Tools Workshop
Southern California Wildfires OMI UV Aerosol Index AIRS Carbon Monoxide (CO) OMI Tropospheric NO2 MODIS Cloud Optical Thickness MODIS Small Aerosol Fraction MODIS Aerosol Mass over Land Teaching With New Geoscience Tools Workshop
Access to current Giovanni interfaces: http://disc.gsfc.nasa.gov/techlab/giovanni Teaching With New Geoscience Tools Workshop
Access to current Giovanni interfaces: http://disc.gsfc.nasa.gov/techlab/giovanni Teaching With New Geoscience Tools Workshop
Sample Science Questions • 1. How has rainfall changed in the Sudan? • http://disc.gsfc.nasa.gov/techlab/giovanni • click on TRMM rainfall products (TOVAS) • click on monthly global precipitation (GPCP), non-Java version • 5-22 N Lat, 23-35 E Lon, Accumulated Rainfall, Time Series (area-averaged), Jan 1979-Dec 2006, Generate Plot • A plot shows up in another browser window • From the plot it is difficult to see a dramatic trend… Teaching With New Geoscience Tools Workshop
Sample Science Questions • 1. How has rainfall changed in the Sudan? • Return to main window and click on ASCII Output button at bottom • ASCII output pops up in separate browser window, save as text file • Open text file in Excel, sort by month and plot up Jan. and July Teaching With New Geoscience Tools Workshop
Sample Science Questions • 1. How has rainfall changed in the Sudan? • While winter (January) rainfall rates are flat, summertime rates (July, the “rainy season”) have fallen 18% over the past three decades • This is a contributing factor in the current crisis in Darfur. • You can’t do everything in Giovanni alone, but sometimes a simple spreadsheet program can provide all the additional computational power to address complex issues. Teaching With New Geoscience Tools Workshop
Sample Science Questions • 2. How has rainfall changed in Wyoming? • http://disc.gsfc.nasa.gov/techlab/giovanni • click on TRMM rainfall products (TOVAS) • click on monthly global precipitation (GPCP), non-Java version • 41-45 N Lat, 111-104 W Lon, Accumulated Rainfall, Lat-Lon Map, Jan 1979-Dec 1986, custom y-axis: min 2000, max 4000, interval 200, Generate Plot • A plot shows up in another browser window • Save plot as gif file Teaching With New Geoscience Tools Workshop
Sample Science Questions • 2. How has rainfall changed in Wyoming? • Do the same plots for 1989-1996 and 1999-2006 1979-1986 1999-2006 Range: 2,600-4,000 mm/month Range: 2,300-2,400 mm/month 1989-1996 Range: 2,400-2,800 mm/month Large portions of the American plains, Rockies and West are becoming more uniformly dry. Teaching With New Geoscience Tools Workshop
Sample Science Questions 3. Is there an “ozone hole” in the Arctic? TOMS 4. What does the El Niño look like? AIRS 5. Is there a connection between central Atlantic sea temperatures and hurricanes? Hurricane Portal 6. Is the surface temperature changing differently in the two hemispheres? AIRS 7. Can one detect Canadian summertime boreal forest fires from space? MODIS 8. How do wildfires in the Western US differ from urban smog? OMI, MODIS, AIRS Teaching With New Geoscience Tools Workshop