Download
1 / 55
550 likes | 559 Vues
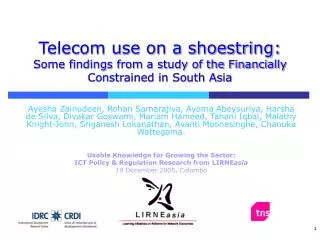
Telecom use on a shoestring: Some findings from a study of the Financially Constrained in South Asia.

E N D
Telecom use on a shoestring:Some findings from a study of the Financially Constrained in South Asia Ayesha Zainudeen, Rohan Samarajiva, Ayoma Abeysuriya, Harsha de Silva, Divakar Goswami, Mariam Hameed, Tahani Iqbal, Malathy Knight-John, Sriganesh Lokanathan, Avanti Moonesinghe, Chanuka Wattegama. Usable Knowledge for Growing the Sector: ICT Policy & Regulation Research from LIRNEasia 19 December 2005, Colombo
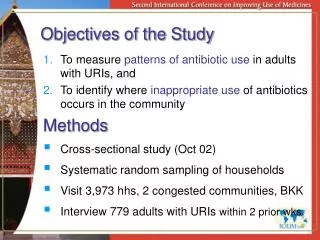
Objectives of the Study • Understand the use of telecom services by the ‘financially constrained’ in South Asia • To what extent do they use it? • What benefits do they gain from use? • How do they use it? • Why do they use it the way that they do?
Sample • Surveys in India & Sri Lanka (3199 in total) • Not representative of India & Sri Lanka as wholes • ‘Users’ • those who have used a phone in the last three months • ‘Financially constrained’ users: • Socio-Economic Classification (SEC) groups B,C,D & E Monthly income < USD100 • Mix of urban (37.5%) and rural (62.5%) respondents
Methodology • Face-to-face interviews • Questionnaire: • Closed-ended • Pilot-tested (in India and SL) and refined • Designed by LIRNEasia team (6) with implementing partner • Sampling • Purposive selection of localities • Random selection of households • KISH grid used to select within households
Sri Lanka: 1100 respondents, 4 localities, 2 languages Jaffna – post conflict area, high migration Badulla – rural, plantation economy, hill country Colombo - capital city, urban landscape Hambantota – rural, tsunami affected
Dehradoon – agrarian economy, foothills of Himalayas Gorakhpur – agrarian economy Neemuch - flat, arid area Cuttack – poor area, high migration Mumbai – metropolitan, in Asia’s largest slum Kasargod – fisheries & remittance based economy Sivaganga – trading, fishing & agrarian economy India: 2099 respondents, 7 localities, 5 languages ‘Northern’ ‘Southern’
Questionnaire • ‘Mode’ of access: • fixed, mobile, ‘public access’ • Reasons for selecting mode • Ownership & use by other people • How telecom services are used • Usage patterns • What they are used for (purposes) • Ways in which they are used (strategies) • Difficulties faced • Use of Internet & telegrams
Limitations • Difficult to make accurate comparisons with groups not studied (financially ‘unconstrained’) • Closed ended questionnaire • Could have been supplemented with Focus Group Discussions • Calling patterns based on recall data • Weaknesses in a few questions
Findings • How the financially constrained communicate • Why they choose fixed, mobile or public phones • What they use them for • How they use them • Constraints & considerations • Expenditure & cost perceptions
…but 58% do not own one! Phone ownership doubles in higher income groups
Fixed (49%) Mobile (19%) 2% 21% 11% 3% 3% 23% 37% Base: 3199 ‘Public’ access (66%) 66% use public access phones
Non-owners (fixed) mostly use PCOs and payphones to make calls
I allow ‘others’ to use my phone Fixed users Mobile users
…reflects availability of service • wide availability of PCO in India • India & Sri Lanka almost same penetration on fixed • Sri Lanka higher in mobile but India growing too • Sri Lanka had mobile since 1989; India since 1994 • India converted to CPP in 2003; Sri Lanka is still RPP
100 90 USD50-100 80 per month 70 60 <USD50 50 % of respondents per month 40 30 20 10 0 Sri Lanka India ...and larger group of poorer people in Indian sample
60 50 40 average number of calls per month 30 20 10 0 outgoing incoming outgoing incoming fixed mobile Sri Lanka Northern India Southern India Usage patterns:mobile users make more calls than fixed users in Sri Lankan and Northern Indian sample (incl. public phone users)
SMS use is low… What they use SMS for: Why they use it: 59% of SMS users use English language for messages
83 % of mobile users on pre-paid Base: all respondents
Basket methodology • Based on OECD methodology with modifications • RPP • Prepaid & post-paid • Based on monthly tariffs of cheapest tariff package of largest operator in each country • India – Airtel (Bharti) – 28% (July’05) • Sri Lanka – Dialog Telkom – 60% (July ’05) • Basket includes airtime (in/out), SMSs, rental & connection charges + free airtime & SMSs
% of users who chose a mode for reason... social status 80 economical to make calls fashion SYMBOLIC 60 economical to receive calls value added services COST 40 20 control costs privacy Fixed 0 Mobile Public access no other choice mobility Base: full CONVENIENCE sample Fixed:1580 Mobile: 616 Public access: 2106 clear connection easy to use save on travel time and cost easy to access can use at any time Why people choose phones: Cost & convenience
RELATIONSHIP MAINTAINANCE keeping in touch (local) 100 80 access Internet keeping in touch (international) 60 fixed 40 mobile 20 public access arranging logistics send news & messages 0 BASES: Fixed: 1580 Mobile: 616 Public: 2106 business transactions /enquiries receive news & messages INSTRUMENTAL financial transactions What they use phones for: relationship maintenance
keeping in touch (national) 100 80 access Internet keeping in touch (international) 60 40 SL 20 India Bases: arranging logistics 0 send news & messages SL: 374 India: 242 business transactions/enquiries receive news & messages financial transactions Use of mobiles: relationships in SL; also some instrumental use in India
Relationship maintenance instrumental Gender Patterns:Fixed: men use the phone for relationship maintenance as much as women * Statistically significant difference *
Relationship maintenance instrumental Same story on mobiles (minor difference on business transactions) … *
Relationship maintenance instrumental …and public access * *
43 % of mobile owners switch off their phone: not for cost reasons COSTFACTORS
Time of day that users make calls * No peak-off peak differentials on mobile in India
Little strategic use… • Little discretion in the few calls that they make • Heavier users use a few more strategies • Few options to make use of strategies • 69% have access to only one mode • Majority are using other people’s phones • 58% don’t own phones
Getting connected: Financing fixed line connections slightly harder in Sri Lanka – use of installment plans Use of installment plans on fixed phones
Reflects connection charges for fixed phones • Sri Lanka incumbent = USD 180 (min.) • Sri Lanka entrants = USD 120 • India incumbent = USD 16
Opposite case in mobiles in Sri Lanka:less people had money available for connection Where owners got money for the connection from
Getting handsets: 10% got it free; 33% of Indians bought second-hand handsets
no difficulties phone did not get connected immediately India Sri Lanka wasn't treated well because didn't have 'contacts' Base: had to pay bribes SL: 212 India: 647 had to make many visits to office (fixed owners) too much paper work waiting time of over 1 year had to go to another town to get connected lack of information on phone options had to wait for service to become available difficulty in finding the money 0 10 20 30 40 50 60 70 % who faced difficulty Difficulties in getting fixed connections:waiting time, paper work, & other inconveniences in India
no difficulties phone did not get connected immediately India wasn't treated well because didn't have 'contacts' Sri Lanka Base: had to pay bribes SL: 322 India: 187 had to make many visits to office (mobile owners) too much paper work waiting time of over 1 year had to go to another town to get connected lack of information on phone options had to wait for service to become available difficulty in finding the money 0 10 20 30 40 50 60 70 % who faced difficulty Obtaining a mobile connection: it’s relatively easier…
Cost of using the phone: Mobile is perceived to be the least affordable 100 extremely high / very high / high 80 60 extr.high/v.high/high % of users who find the cost... affordable 40 Full sample Bases fixed: 1580 20 affordable public: 2106 mobile: 616 0 Fixed Public Mobile mode of access
But more affordable in India 100 extremely high / very high / high 80 60 % of users who find the cost... 40 Bases SL: 374 India: 242 20 affordable affordable 0 Sri Lanka India Mobile affordable extr.high/v.high/high
33 % of Jaffna sample spend more than USD12 per month on mobile
‘on average, around the world, people spend about 2-3% of their income on telecommunication’ Telecommunications Regulation Handbook, infoDev, module 6, p.6.6 Graph taken from Telecommunications Regulation Handbook, infoDev; module 6
Rural respondents perceive fixed phones to be more affordable, and less likely to change use if price changed Perception of current costs Base: fixed (only) users Change in usage if costs were halved • Reflects telecom/transportation trade-off • Access deficit charge in India ensures lower cost of rural fixed phones
Mobiles perceived to be more costly & use would increase if costs were halved; rural users a little happier about cost Base: mobile (only) users Perception of current costs Change in usage if costs were halved Reflects the said reasons for choice of mobile : convenience
Public access: more affordable in rural areas Perception of current costs Base: Public access (only) users Change in usage if costs were halved Despite respondents in India perceiving current costs to be affordable, they are willing to increase phone usage if costs were halved.