Download
1 / 42
420 likes | 549 Vues
Forecasting Distributions of Warm-Season Precipitation Associated with 500-hPa Cutoff Cyclones. Matthew A. Scalora, Lance F. Bosart, Daniel Keyser Dept. of Atmospheric and Environmental Sciences University at Albany/SUNY, Albany, NY Neil A. Stuart and Thomas A. Wasula NOAA/NWS, Albany, NY

E N D
Forecasting Distributions of Warm-Season Precipitation Associated with 500-hPa Cutoff Cyclones Matthew A. Scalora, Lance F. Bosart, Daniel Keyser Dept. of Atmospheric and Environmental Sciences University at Albany/SUNY, Albany, NY Neil A. Stuart and Thomas A. Wasula NOAA/NWS, Albany, NY 29 June 2009 NOAA/CSTAR Grant NA07NWS4680001
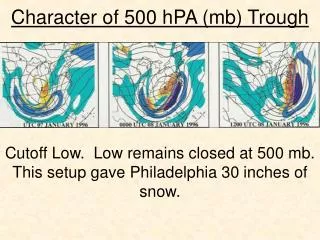
Motivation • Forecasting heavy precipitation and severe weather associated with slow-moving 500-hPa cutoff cyclones is a challenge • Models often have trouble predicting evolution of cutoffs and accurate precipitation amounts • Complex terrain over the northeastern U.S. plays a significant role in modulating precipitation distributions in cutoffs
Objectives • Study 20 warm-season cases of cutoff cyclones that tracked through the northeastern U.S. and affected the region with varying amounts of precipitation and severe weather 2) Investigate the 23–25 July 2008 cutoff cyclone by examining dynamic and thermodynamic fields and features throughout the troposphere
Datasets and Methodology • 1.0° GFS analysis (2000–2006 cases) and 0.5° GFS analysis (2007–2008 cases) used to create isobaric charts • 2.5° NCEP–NCAR reanalysis used to derive climatological fields consisting of centered 15-d means from 1979–2008 for: - wind speed - temperature - lapse rate - precipitable water
Datasets and Methodology • 1.0° and 0.5° GFS analyses used to calculate standardized anomalies with respect to climatological fields created from NCEP–NCAR reanalysis • 24-h precipitation amounts from the NCEP/CPC Unified Precipitation Dataset (2000 cases) and NWS National Precipitation Verification Unit (2001–2008 cases)
Methodology for Case Selection • 500-hPa cyclone is a cutoff if a 30-m height rise is found in all directions from a height minimum for at least 12 h • 45 total storm days in conjunction with 20 cutoff cyclone cases over the last nine warm seasons (June–September) • Days defined as 1200–1200 UTC
Methodology (cont.) 1) Rank 45 storm days by precipitation amounts - Fraction of New England, NY, PA, and NJ receiving at least 25 mm of precipitation - Determine PWAT anomalies averaged over precipitating areas • Examine all 45 storm days for evidence of distinctive synoptic-scale flow patterns and stratify resulting patterns - Positive, neutral, and negative tilts classified for each 500-hPa cutoff–trough system 3) Create schematics using composited data from the two 6-h times of heaviest precipitation for each storm day (usually 1800 and 0000 UTC)
Methodology for Tilt - Some cutoff cases spanning multiple days have varying tilts throughout the case Negative tilt if α ≤ –20° Positive tilt if α ≥ 20° Neutral tilt if –20° < α < 20°
Results Five distinct patterns of lower-, middle-, and upper-level features based on 500-hPa cutoff–trough system tilt (two positive, two neutral, one negative)
Five Synoptic-Scale Flow Patterns • Positive Tilt “Type A” Southerly low-level flow, zonal upper-level jet along the downstream upper-level ridge 2)Positive Tilt “Type B” Easterly low-level flow, upper-level jet within eastern side of trough that envelops cutoff 3)Neutral Tilt “Type A” Southerly low-level flow 4)Neutral Tilt “Type B” Westerly low-level flow • Negative Tilt Northwesterly low-level flow
Positive Tilt “Type A” Neutral Tilt “Type A” Positive Tilt “Type B” Neutral Tilt “Type B” Negative Tilt • Precipitation amounts trend directly with PWAT • PWAT > 2 SD above normal is fairly uncommon but yields heavy precipitation over a large area
Positive Tilt “Type A” Composites N = 4/20 cases
Positive Tilt “Type A” Composites N = 4/20 cases
Positive Tilt “Type A” Severe Weather: Average is 8 reports/day; mostly high wind reports Precipitation Modes: Stratiform and convective N = 4/20 cases
Positive Tilt “Type B” Severe Weather: Average is 6 reports/day Precipitation Modes: Stratiform bands with embedded convection N = 6/20 cases
Neutral Tilt “Type A” Severe Weather: Average is 33 reports/day; hail common under upper cold pool Precipitation Modes: Stratiform and convective bands N = 7/20 cases
Neutral Tilt “Type B” Severe Weather: Average is 57 reports/day; mostly hail Precipitation Modes: Mostly convective N = 4/20 cases
Negative Tilt Severe Weather: Average is 21 reports/day; mostly hail Precipitation Modes: Only convective N = 3/20 cases
CASE STUDY 23–25 July 2008 Cutoff Cyclone
Overview • Cutoff cyclogenesis from preexisting positively tilted trough over eastern Canada • Dominant precipitation modes: convective lines/bow echoes, supercells, stratiform rain regions • Widespread flash flooding and storm-total precipitation amounts of 7–9 cm along north–south-oriented bands • Numerous hail and wind reports • Two tornadoes over New England
3-d (1200 UTC 22 July–1200 UTC 25 July 2008) mean 500 hPa Z (dam); track of 500-hPa cutoff cyclone center
SPC Storm Reports: 23 July 2008 Tornado Wind Hail
Radar Base Reflectivity (dBZ) 1218 UTC 23 July 1804 UTC 23 July
Radar Base Reflectivity (dBZ) Surface Observations 0121 UTC 24 July 0100 UTC 24 July Temp (°C; contoured) Temp (°C),Dewpoint (°C), SLP (hPa)
1800 UTC 23 July 0000 UTC 24 July
1800 UTC 23 July 0000 UTC 24 July
1800 UTC 23 July 0000 UTC 24 July
1800 UTC 23 July 0000 UTC 24 July
23 July 2008 Summary • Cutoff exhibits deep cyclonic flow with embeddedvorticity maxima and corridor of strong low-level wind shear • Right-entrance region of upper-level jet streak provides favorable QG forcing for ascent • Surface boundary and 850-hPa θe ridge provide focus for severe weather • Convergence of moisture streams from Gulf of Mexico and western North Atlantic contributes to heavy precipitation over the northeastern U.S.
SPC Storm Reports: 24 July 2008 Tornado Wind Hail
Radar Base Reflectivity (dBZ) 1549 UTC 24 July Surface Observations 1500 UTC 24 July Temp (°C; contoured) Temp (°C),Dewpoint (°C), SLP (hPa) Tornado touchdown at 1533 UTC
1200 UTC 24 July 1800 UTC 24 July
1200 UTC 24 July 1800 UTC 24 July
1200 UTC 24 July 1800 UTC 24 July
1200 UTC 24 July 1200 UTC 24 July
24 July 2008 Summary • Cutoff orientation pivots from neutral to negative tilt • Surface boundaries and associated convergence enhance convection within rainband over eastern New England • Surface boundaries and strong low-level jet provide focus for severe weather • Hail occurs in region of steep midlevel lapse rates beneath cold pool coinciding with cutoff cyclone
Conclusions • Upper-level jets, midlevel vorticity maxima, and surface boundaries associated with cutoff cyclone are important for determining precipitation distribution • Surface boundary, low-level θe ridge, and low-level jet provide focus for severe weather
Conclusions (cont.) • Anomalously high precipitable water values contribute to widespread heavy precipitation • Steep lapse rates below cold-core cutoff cyclone favor hail occurrence • Schematics of five distinct patterns of lower-, middle-, and upper-level features useful in determining where precipitation or severe weather will be most significant
Acknowledgements • Lance Bosart and Dan Keyser • NWS focal points Neil Stuart and Tom Wasula • Kevin Tyle and Dave Knight • Faculty and grad students • Allison and family