Download
1 / 1

E N D
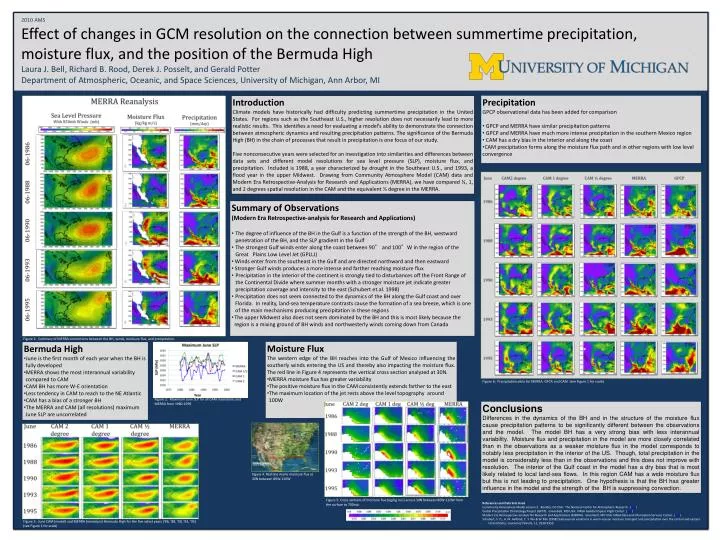
2010 AMSEffect of changes in GCM resolution on the connection between summertime precipitation, moisture flux, and the position of the Bermuda HighLaura J. Bell, Richard B. Rood, Derek J. Posselt, and Gerald PotterDepartment of Atmospheric, Oceanic, and Space Sciences, University of Michigan, Ann Arbor, MI Introduction Climate models have historically had difficulty predicting summertime precipitation in the United States. For regions such as the Southeast U.S., higher resolution does not necessarily lead to more realistic results. This identifies a need for evaluating a model's ability to demonstrate the connection between atmospheric dynamics and resulting precipitation patterns. The significance of the Bermuda High (BH) in the chain of processes that result in precipitation is one focus of our study. Five nonconsecutive years were selected for an investigation into similarities and differences between data sets and different model resolutions for sea level pressure (SLP), moisture flux, and precipitation. Included is 1988, a year characterized by drought in the Southeast U.S., and 1993, a flood year in the upper Midwest. Drawing from Community Atmosphere Model (CAM) data and Modern Era Retrospective-Analysis for Research and Applications (MERRA), we have compared ½, 1, and 2 degrees spatial resolution in the CAM and the equivalent ½ degree in the MERRA. • Precipitation • GPCP observational data has been added for comparison • GPCP and MERRA have similar precipitation patterns • GPCP and MERRA have much more intense precipitation in the southern Mexico region • CAM has a dry bias in the interior and along the coast • CAM precipitation forms along the moisture flux path and in other regions with low level convergence • Summary of Observations • (Modern Era Retrospective-analysis for Research and Applications) • The degree of influence of the BH in the Gulf is a function of the strength of the BH, westward penetration of the BH, and the SLP gradient in the Gulf • The strongest Gulf winds enter along the coast between 90° and 100°W in the region of the Great Plains Low Level Jet (GPLLJ) • Winds enter from the southeast in the Gulf and are directed northward and then eastward • Stronger Gulf winds produces a more intense and farther reaching moisture flux • Precipitation in the interior of the continent is strongly tied to disturbances off the Front Range of the Continental Divide where summer months with a stronger moisture jet indicate greater precipitation coverage and intensity to the east (Schubert et.al. 1998) • Precipitation does not seem connected to the dynamics of the BH along the Gulf coast and over Florida. In reality, land-sea temperature contrasts cause the formation of a sea breeze, which is one of the main mechanisms producing precipitation in these regions • The upper Midwest also does not seem dominated by the BH and this is most likely because the region is a mixing ground of BH winds and northwesterly winds coming down from Canada Figure 1: Summary of MERRA connections between the BH, winds, moisture flux, and precipitation. • Moisture Flux • The western edge of the BH reaches into the Gulf of Mexico influencing the southerly winds entering the US and thereby also impacting the moisture flux. The red line in Figure 4 represents the vertical cross section analyzed at 30N. • MERRA moisture flux has greater variability • The positive moisture flux in the CAM consistently extends farther to the east • The maximum location of the jet rests above the level topography around 100W • Bermuda High • June is the first month of each year when the BH is fully developed • MERRA shows the most interannual variability compared to CAM • CAM BH has more W-E orientation • Less tendency in CAM to reach to the NE Atlantic • CAM has a bias of a stronger BH • The MERRA and CAM (all resolutions) maximum June SLP are uncorrelated Figure 6: Precipitation plots for MERRA, GPCP, and CAM (see Figure 1 for scale) Figure 2: Maximum June SLP for all CAM resolutions and MERRA from 1980-1999 Conclusions Differences in the dynamics of the BH and in the structure of the moisture flux cause precipitation patterns to be significantly different between the observations and the model. The model BH has a very strong bias with less interannual variability. Moisture flux and precipitation in the model are more closely correlated than in the observations as a weaker moisture flux in the model corresponds to notably less precipitation in the interior of the US. Though, total precipitation in the model is considerably less than in the observations and this does not improve with resolution. The interior of the Gulf coast in the model has a dry bias that is most likely related to local land-sea flows. In this region CAM has a wide moisture flux but this is not leading to precipitation. One hypothesis is that the BH has greater influence in the model and the strength of the BH is suppressing convection. Figure 4: Red line marks moisture flux at 30N between 80W-110W Figure 5: Cross sections of moisture flux (kg/kg m/s) across 30N between 80W-110W from the surface to 700mb. References and Data Sets Used Community Atmosphere Model version 3. Boulder, CO USA: The National Center for Atmospheric Research. (link) Global Precipitation Climatology Project (GPCP). Greenbelt, MD USA: NASA Goddard Space Flight Center. (link) Modern Era Retrospective-analysis for Research and Applications (MERRA). Greenbelt, MD USA: NASA Data and Information Services Center. (link) Schubert, S. D., H. M. Helfand, C. Y. Wu & W. Min (1998) Subseasonal variations in warm-season moisture transport and precipitation over the central and eastern United States. Journal of Climate, 11, 2530-2555. Figure 3: June CAM (model) and MERRA (reanalysis) Bermuda High for the five select years (‘86, ‘88, ‘90, ‘93, ’95) (see Figure 1 for scale)