Download
1 / 51
510 likes | 644 Vues
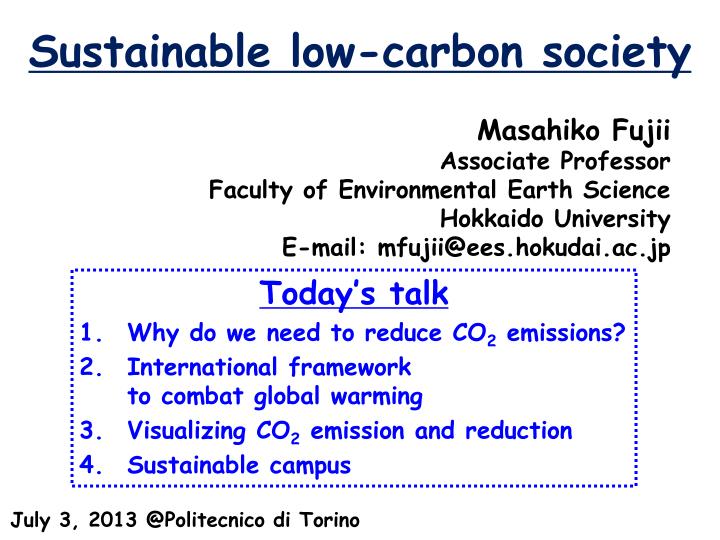
Sustainable low-carbon society. Masahiko Fujii Associate Professor Faculty of Environmental Earth Science Hokkaido University E-mail: mfujii@ees.hokudai.ac.jp. Today’s talk

E N D
Sustainable low-carbon society Masahiko Fujii Associate Professor Faculty of Environmental Earth Science Hokkaido University E-mail: mfujii@ees.hokudai.ac.jp Today’s talk • Why do we need to reduce CO2 emissions? • International framework to combat global warming • Visualizing CO2 emission and reduction • Sustainable campus July 3, 2013 @Politecnico di Torino
1. Why do we need to reduce CO2 emissions? 1.1. From the view point of global warming 1.2. From the view point of ocean acidification
Anthropogenic CO2 amounts in the 1990s(Based on IPCC, 2007) To reduce the atmospheric residue to 0 GtCO2/yr, the emission by human activities needs to be limited to 17.6 GtCO2/yr(29.3 – 11.7 = 17.6 GtCO2/yr) CO2 reduction by 40~50% is required !
1.2. From the view point of ocean acidification CO2concentration(Atmosphere, Ocean) pH Year Feely (2008, PICES Press)
Concerned effects of ocean acidification on corals • Decrease in coral calcification rates with lower CaCO3 saturation state (Ω) 2.Adverse effects on early life history stages with lower pH - Lower Ω with higher CO2 concentration- Lower Ω in cold waters 25℃ 5℃ Hoegh-Guldberg (2007, Science)
Criteria for ocean acidification CO2 reduction by 50% is required to stay at the yellow zone for saving biodiversity No alternative way rather than CO2 reduction to mitigate ocean acidification
Multiple reasons for CO2 reduction From the view point of global warming Reduction by 40~50% required From the view point of ocean acidification Reduction by 50% required
2. International framework to combat global warming
(Mt-CO2/year) CO2 Emission from various countries (in 2008) (t-CO2/year/capita) per capita Source: EDMC/Handbook of energy & economic statistics in Japan (2011)
International framework to combat global warming United Nations Framework Convention on Climate Change (UNFCCC) • Adopted at the Earth Summit in Rio de Janeiro in 1992 • COP 3(1997): Adoption of the Kyoto Protocol • COP13(2007): Bali roadmap • COP15(2009): Copenhagen Accord • COP16(2010):Cancun Agreements • UN Conference on Sustainable Development (Rio+20) (June 20th through 22th, 2012) • COP19(2013): Will be held in Warsaw, Poland ※ COP=Conference of the Parties
Emission reduction/limitation target under the Kyoto Protocol(% of base year level) Based on UNFCCC (2010), Annual compilation and accounting report for Annex B Parties under the Kyoto Protocol for 2010
3. Visualizing CO2 emission and reduction CO2 reduction is required How to reduce? Goals and criteria are needed Use indicators
Indicators to visualize CO2 emissions For example, • Food miles • Life Cycle Assessment (LCA) and Carbon Footprint
Life Cycle Assessment (LCA) - An approach to calculate environmental burdens (e.g. CO2 emissions) from each processes of manufactured goods CO2 Production CO2 Transport CO2 Consumption CO2 Transport CO2 Disposal
GHG emissions related to private consumption(estimated by Swiss Federal Institute of Technology Zurich) Health, communication, education, clothing, others Food supply Leisure time, culture & restaurants Mobility Habitation
Quiz 1: Calculate CO2 emission to supply 1kg tomatoes to Torino Two choices: • Use tomatoes produced nearby Torino (in Piemonte) • Use tomatoes produced at a major production area (in Campania)
Cultivation method of tomatoes Over 5℃: grown outdoors Below 5℃: hothousesusing crude oil (emitting CO2)
CO2 emission to supply 1kg tomatoes to Torino (estimated by using LCA) In spring, summer and autumn Tomatoes grown outdoors 192 gCO2 Tomatoes grown outdoors 192 gCO2 Bra (cool place) 58km 932km Salerno (warm place) Torino Track delivery 11 gCO2 Track delivery 166 gCO2 < 192 + 11 = 203 gCO2 192 + 166 = 358 gCO2 (Reference: http://www.nissui.co.jp/academy/market/12/market_vol12.pdf http://www.travelmath.com/)
CO2 emission to supply 1kg tomatoes to Torino (estimated using LCA) In winter Hothouse tomatoes 771 gCO2 Tomatoes grown outdoors 192 gCO2 Bra (cool place) 58km 932km Salerno (warm place) Torino Track delivery 11 gCO2 Track delivery 166 gCO2 > 771 + 11 = 782 gCO2 192 + 166 = 358 gCO2 (Reference: http://www.nissui.co.jp/academy/market/12/market_vol12.pdf http://www.travelmath.com/)
Greenhouse gas (GHG) emissions from Nagoya Central Wholesale Market(中島他 (2010) 第5回日本LCA学会研究発表会講演要旨集を基に作図) Nagoya
Local production for local consumption of food (with less food miles) is not always the best way with regard to reducing CO2 emission by food supply However, local production/consumption of food • Reduces risks in food (less antiseptics and less added substances) • Creates local industries, such as food processing industry • Enhances food security (enhancing self-support ratio of food) How about raising products in hothouses fueled by renewable energy?
Quiz 2: To calculate CO2 emission by cultivating asparagus in a hothouse A new method: heated by hot spring water Typical cultivation method: heated by electrically heated wires
Cultivating asparagus in a hothouse heated by hot-spring heat Merits • CO2 reduction by 75% • Creating new local industries • Higher selling prices with added values Demerit • Higher cultivation costs than usual with current oil prices Carbon pricing is necessary A tasting party of harvested asparagus at a city hall
Self-support ratio of food [%] Source: 農林水産省「食料需給表」 1960 1970 1980 1990 2000 Year Self-support ratio of food in Japan • On the decline (78% in 1960 40% in 2000) • Lowest among the advanced countries
If Japan close the country to foreign again … 68% 5% 41% 57% 79% 67% 95% 5% Without import products With import products
Carbon footprint http://www.consoglobe.com/ac-marques-ecologiques_2365_co2-leclerc-teste-etiquetage-c02-produits.html A measure of the amount of greenhouse gas emissions produced in our day-to-day lives Harvest:29g Food processing:14g Packaging:27g Transport:8g Disposal:2g Total:80g http://www.walkerscarbonfootprint.co.uk/walkers_carbon_footprint.html
CO2 emissions for a can of beer(350ml aluminum can) (サッポログループCSRレポート2008に基づき計算) http://www.sapporobeer.jp/CGI/newsrelease/detail/00000010/
Approaches to reduce CO2 emission by smart choice of food Everyone eats every day • Everyone can practice right now with ease Strongly depends on individual taste and action Provides co-benefits ・A concept of “local production for local consumption” contributes to food security and local economy ・ ”Slow food” Lifestyles of health and sustainability (LOHAS)
4. Sustainable Campus • University’s corporate social responsibility (USR) to reduce environmental burdens • Self-education and enlightenment to students and staffs on campus who engage in such activities • Testing bench for new technology and policy for sustainability
Hokkaido University Sapporo Campus as a “miniature town” • Has large daytime population of 22,000, consisting of students and staffs • Has wide farms as well as many facilities such as cafeterias, supermarkets, book stores, barbers, hospitals etc. • Many trial experiments and measures can be applied to the campus to reduce environmental burdens including CO2 emission
Fact • Hokkaido University is one of the largest business institutions in Hokkaido Prefecture • 0.1% of Hokkaido’s greenhouse gas emission from Hokkaido University (Yamada et al., 2011) • The current CO2 emission from Hokkaido University has been doubling since 1990 (cf. the Japan’s emission reduction target under the Kyoto Protocol is 6% of the 1990 level) The CO2reduction on campus is socially required
Medical colleges Megaversities Energy consumption per floor area (GJ/m2/yr) Different actions needed to reduce CO2 emissions on campus, based on individual characteristics of each college/university (文部科学省 (2010): 施設マネジメントに関するベンチマーク手法 -国立大学法人等における良好なストックの形成を目指して-.) Colleges of education Floor area (thousand m2)
Two major characteristics of Sapporo Campus • In cold Hokkaido 2. A large amount of organic wastes on campus Leftover food Feces and urine Dead leafs and grass Wood
Assessment of the possibility of introducing a recycling system of organic wastes on campus Objective of this study • To examine the possibility of introducing new recycling systems of organic wastes on campus, by assessing the effects in terms of CO2 reduction and economy • To establish the new recycling systems of organic wastes on campus
Sapporo Campus Out Out Current system Composting Leftover food Food Cooking Consumption Sell Production Farm products Sell Compost Dead leaf and grass Leaf soil Composting Dead and pruned branch Sheeting Wooden chip Chop Oil Heating
Sapporo Campus Out Out Current system, Scenario 1 Current system, New system Current system Composting Leftover food Food Cooking Consumption Composting Sell Production Farm products Sell Compost Production Dead leaf and grass Leaf soil Composting Sheeting Dead and pruned branch Wooden chip Chop Oil Heating
Results Effects of new recycling systems on CO2 reduction -97 t-CO2/yr -63 t-CO2/yr
Conclusion • A new system of organic wastes are effective with regard to greenhouse gas reduction on campus • The economic merits of introducing the new system are still controversial • Introducing on-campus composting and wooden chip stoves will be economically more effective in future when oil prices are supposed to keep rising and carbon pricing (such as the carbon tax) becomes more common • The new system can also lead to more job opportunities on campus • Such results are considered to be of some help to local governments to design future policy making for balancing environmental conservation and regional vitalization
Toward sustainable low-carbon society Climate change GW & OA Human activity • Inevitable • Medium-term • Predictable Adaptation • Evitable • Short-term • Predictable Mitigation • Evitable • Long-term • Predictable Mitigation (& Adaptation) + + We need: • Further scientific knowledge for more accurate assessment and projection (visualization needed!!) • Adaptive responses based on precautionary principle • Paradigm shift from mass production/consumption to sustainable low-carbon society
My Sustainability … 吾唯足知 I learn only to be contented. (京都 龍安寺 Ryouanji Temple, Kyoto)
Greenhouse Gas (GHG) Emissions in Japan(1990-2011) Japan’s target: -6% in the First Commitment Period (2008-2012) Source: Greenhouse Gas Inventory Office of Japan, National GHGs Inventory Report of JAPAN (2013), The GHGs Emissions Data of Japan (1990-2011)
Time Series of Energy Self-support Ratio in Japan (1960 – Present) Source: エネルギー白書 (2006年版)