Download
1 / 29
310 likes | 587 Vues
G. H. G. Prepared By: Thomas Szatkowski, ARAMARK. Rosemont College. GHG Inventory Report. December, 2010. Executive Summary. Team Members Executive Summary Introduction Presidents Climate Commitment Greenhouse Gas Inventory Approach and Process Carbon Footprint

E N D
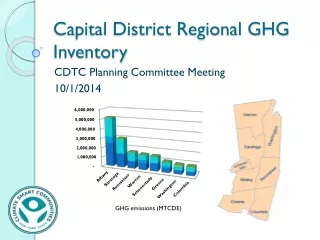
G H G Prepared By: Thomas Szatkowski, ARAMARK Rosemont College GHG Inventory Report December, 2010
Executive Summary • Team Members • Executive Summary • Introduction • Presidents Climate Commitment • Greenhouse Gas Inventory Approach and Process • Carbon Footprint • GHG Baseline school year ending 2007 - 3,233 metric tonnes eCO2 emitted • GHG Emissions ending FY 2010 - 3,291 metric tonnes eCO2 emitted increase of 1.8% from 2007 • Conclusion • Carbon Footprint through FY ending 2010 • Year over Year Comparisons • Rosemont’s Next Steps
Climate Commitment-Team Members Rosemont College, Climate Commitment Committee Sharon Hirsh Ph.D., President of the College Sr. Jeanne Hatch, VP of Mission Thomas Szatkowski, Director of Facilities Anthony Wolcott, AssistantDirector of Facilities Ann Marshall, Infrastructure Committee & Alum Courtney Leik , Faculty Richard Cuba, Food Service Director Project Team Thomas Szatkowski, Director of Facilities Anthony Wolcott, Manager of Facilities Butch Brown, Director of Operations Patricia Peterson, Office Manager, Facilities Advisory Panel - ARAMARK Brian Datte, District Manager Eastern Region Christopher Flouris, Project Engineer
Executive Summary • The Greenhouse Gas Inventory is Rosemont College’s 2nd report of GHG Emissions FY ending 2010. This report will be made public on the American College and University Presidents Climate Commitment web site. • Determines Rosemont’s Carbon Footprint • Measure of the impact due to human activities on the environment in terms of amount of greenhouse gases produced • This Greenhouse Gas Inventory was performed in the Fall of 2010 using the Clean-Air Cool-Planet’s Carbon Calculator version 6. • Report is inclusive of all campus operations and activities
Introduction Image from:http://cheeju.files.wordpress.com/2007/10/earth-space002.jpg
G H G President’s Climate Commitment (ACUPCC)
Contextual Overview • Rosemont College, School Year Ending 2010 • Rosemont, PA • 397,124 GSF • 616 Full-time Students, 590 Part Time Students • Faculty FTE 70, Staff FTE 131
Greenhouse Gas Inventory Approach & Process Assignment & Accountability 5/26/2010 • - Determine departmental participation and department leader • - Prepare and submit data request templates • Review department roles and responsibilities Meeting with Person(s) Accountable • Review collection process with each department lead • Discuss department accountability and communication protocols • Meet with student groups • Define collection timeline and deadlines 9/30/2010 Actions & Deadlines Defined 12/30/2010 • Consolidation of data entry submittals from each department leader • Analyze data, make assumptions and document anomalies • Present data findings with Institution’s Environmental Committee • Provide report for submission to ACUPCC by Rosemont College
Emission Factors • All results are reported in Carbon Dioxide Equivalents, eCO2 • Allows comparison of all types of greenhouse gases • Converted using respective individual heat trapping potential (global warming potential) • Intergovernmental Panel on Climate Change (IPCC) • Provides the accepted values for global warming potentials (GWP)
Site and Source Emissions Purchased Electricity • Rosemont's Electric Region is Mid-Atlantic Area Council (MAAC) • PECO Electricity Production Fuel Mixture Consists of Nuclear, Natural Gas, #6 Fuel Oil, and #2 Fuel Oil • Natural Gas • #2 Fuel Oil • Student and Employee Commuter Trips • College Fleet Vehicles • Athletics & Faculty Travel • Staff Air Miles • HCFC-22 from Air Conditioning Equipment • Landfill with CH4 recovery and flaring • Synthetic & Organic Fertilizer Stationary Sources Transportation Refrigerants Solid Waste Agriculture
Footprint Calculation • Collect University Data • Purchased Electricity • Purchased Natural Gas & # 2 Fuel Oil • Aggregate Transportation • Refrigerant Usage • Solid Waste Disposal • Clean Air-Cool Planet Campus Carbon Calculator (CA-CP) • Input Data into CA-CP • CA-CP Converts to Generated Emissions
Greenhouse Gas Emission Breakdown 2010 • Scope 1 = Natural Gas/Fuel Oil, Direct Transportation, Refrigerants, Agriculture. Scope 2 = Purchased Electricity. Scope 3 = Commuter Transportation, Air Miles, Solid Waste & Electrical T & D Losses • Rosemont's total GHG emissions in 2010 breakdown Scope 1 = 56%, Scope 2 = 21% & Scope 3 = 23%
On Campus Stationary Combustion Sources Rosemont • Building Heat - Natural Gas & Oil. • Gas Provider Hess Corporation • Oil Provider FC Haab • Each building on the campus has a separate gas & oil meter • 28,379 MMBtu of natural gas • 26,208 gallons of # 2 fuel oil • 1,765 metric tonnes eCO2 emitted 2010 School Year
Purchased Electricity Rosemont • Our provider for Generation is Excelon • Our provider for Transmission is PECO • Beginning January 2011 our provider for Generation will be GDF SUEZ Energy Recourses • All electricity for the campus is collected on one meter • 3,529,932 kWh used in FY 2010 • 691 metric tonnes eCO2 emitted 2010 School Year
Transportation Rosemont • Commuter Transportation, Facility Transportation, Staff Air Miles • Commuter Transportation • Students, Faculty & Staff • 600 metric tonnes eCO2 emitted • University Fleet • Facilities Vehicles, Sports Team Travel & Other Direct Financed Travel • 53 metric tonnes eCO2 emitted • Air Travel • Staff Travel • 37 metric tonnes eCO2 emitted 2010 School Year
Transportation • Transportation was responsible for 23% of the College’s 2010 GHG emissions
Campus Refrigerants • Main refrigerant used: HCFC-22 • Used in Air Conditioning Applications • Release hydro fluorocarbons (HFC’s) • Highest global warming potential • 36 pounds of refrigerant released • 28 metric tonnes eCO2 emitted Rosemont 2010 School Year
Solid Waste Disposal • Waste Hauler: • Allied Waste • Landfill Utilization • Taken to a site with methane recovery and flaring • 153 tonnes of waste produced • 47 metric tonnes of eCO2 emitted Rosemont 2010 School Year
Campus Agriculture Rosemont • Emissions from synthetic/organic fertilizer • 24% nitrogen content • Releases nitrous oxide • 2,450 lbs of fertilizer applied • 2.5 metric tonnes of eCO2 emitted 2010 School Year
Conclusion Image from: http://a.abcnews.com/images/Technology/pd_earth_hand_070904_ms.jpg
Rosemont' Carbon Footprint 2010 • Rosemont emitted 3,291 metric tonnes of eCO2 in 2010
Year over Year Comparisons • 1.8 % emissions increase from 2007 to 2010
Rosemont’s Next Steps 1. GHG Inventory • Submit to AASHE by January. 15, 2011 • Continue data input via CA-CP database • Bi Annually submit inventory to AASHE • All new construction & renovations adheres to LEED Silver standard • Provide more public transportation • Purchase 10% of electricity from renewable sources in 2011 • Continue participation inRecycleManiacompetition • Develop Climate Action Plan • Identify major greenhouse gas emission sources and general reduction strategies • Campus Master Plan • Energy Audit 2. Tangible Actions 3. Action Plan
Rosemont’s Next Steps: To Do Action Plan Analyze Data Target Date • Emissions trajectory for “business as usual” • Determine date for achieving climate neutrality as soon as possible • Energy Audit to determine mitigation strategies and action items to reduce energy and GHG emissions • Calculate financial impact exposures for alternate action items • Incorporate climate neutrality and sustainability into curriculum and other educational experience for students • Implement actions to expand research and other efforts to achieve climate neutrality • Compile action plan into report format in compliance with AASHE Reduction Plan Financial Impacts Sustainability Research Action Plan
Appendix c: ACUPCC Tangible Action Items, Recommendations for adopting the remaining items.
Appendix C: Carbon Equivalents • The EPA’s Greenhouse Gas Equivalencies Calculator was used to convert Rosemont’s emissions. • Rosemont’s 2010 emissions is equivalent to carbon sequestering annually by 702 acres of pine or fir forests or CO2 emissions from the energy use of 285 homes for one year or greenhouse gases produced annuallyby 629passenger vehicles. Image from: http://www.nature.org/wherewework/northamerica/states/delaware/preserves/art12413.html http://smgenglish.typepad.com/photos/uncategorized/2007/07/24/traffic.jpg
Appendix D: Assumptions • Rosemont College’s fiscal year of 2007, from July 2006 to June 2007 was used as a baseline. • Our Electrical supplier PECO indicated the following for electrical production, 10% Coal, 10.3% Natural Gas, 6.4% Fuel Oil #1 – 4, 65.8%% Nuclear, 6.5% Hydro, .4% Purchased & .6% Renewable Energy. • Of all of the solid waste that is disposed by Waste Management at Rosemont College, 97% is brought to a Landfill with CH4 recovery and flaring. Being that it is difficult to determine where the remaining 3% is brought, we approximated that 100% of Rosemont College’s waste ends up in a landfill with CH4 recovery and flaring. • Assumptions were made in scope 3 emissions due to the difficulty obtaining driving habits from students. Data from faculty & staff is well represented. Data was gathered by using parking passes issued, resident student population, non resident student population, full & part time staff & faculty population and zip code. Surveys were also utilized with limited results. The following estimates were made from that data, Full time students were estimated at 15.5 miles x 2 trips per day for 112 days a year, Part time students were estimated at 15.5 miles x 2 trips per day for 56 days a year Faculty were estimated at 15.6 miles x 2 trips per day for 112 days a year and Staff 13.9 miles x 2 trips per day for 225 days a year. Other Directly Financed Travel was also estimated based on year ending 2010 from which we had fair data. Going forward the departments will try to capture this data. A mpg ratio of 5 mpg (Boeing) was used to convert air miles to gasoline consumed.