Download
1 / 43
440 likes | 566 Vues
Generating Wide-Area Content-Based Publish/Subscribe Workloads. Albert Yu , Pankaj K. Agarwal, Jun Yang Duke University. Overview. Publish/Subscribe systems Data extraction Workload generation Conclusion and future work. Publish/Subscribe. Publishers. Subscribers. Brokers.

E N D
Generating Wide-Area Content-Based Publish/Subscribe Workloads Albert Yu, Pankaj K. Agarwal, Jun Yang Duke University
Overview • Publish/Subscribe systems • Data extraction • Workload generation • Conclusion and future work
Publish/Subscribe Publishers Subscribers Brokers Broker network
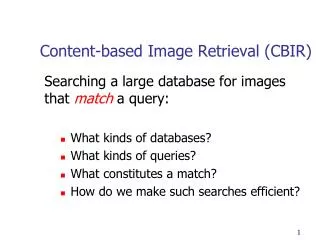
Two tasks • Subscription processing • Match and process each publish event with a large set of subscriptions. • Notification dissemination • Notify those interested subscribers over a network.
Event and network spaces S1 e4 • Event space • Event is a point. • Subscription defines a region (ex: rectangle). • Network space • Network location is a point. • Distance between two network locations approximates the latency between them. e1 e3 e2 S2
Lack of publicly available, realistic workloads • Privacy concern and commercial interests • Lack of widely deployed systems supporting powerful content-based subscriptions
Goal • Collect the limited amount of various statistics available to public. • Generate a workload consistent with these statistics. • Generate other workloads according to user-defined deviations.
Workload components • A set of subscriptions, each of which corresponds to: • A rectangular region of interest in the event space • A point in the network space • An event distribution over the event space • A set of brokers (optional) • A point in the network space
Motivation: Broker-subscriber assignment • How to assign subscribers to brokers? • Cluster subscribers with similar interests • Potentially minimize network traffic. • Letting a broker handle subscribers that are far away • Violate delivery latency requirements. • Increase communication costs. • Balancing semantic similarity and network proximity in dissemination network design is a hard optimization. • Optimal tradeoff depends on the amounts of event matching shared versus disjoint interests.
Motivation: Broker-subscriber assignment • Take into account • Subscription interest • Subscription location • Event distribution • Exploring correlation between event and network spaces provides more optimization opportunities.
Related work • Characterize pub/sub systems • Properties of RSS feeds [Liu et al.’ 05] • Stock popularity in NYSE [Tock et al.’05] • Simple synthesized workloads • Event space • Uniform and Gaussian distributions [Baldoni et al.’07] • Zipf distribution [Bianchi et al.’07] • Network space • Subscribers are located uniformly or randomly in the network [Baldoni et al.’07, Papaemmanouil and Cetintemel’05]
Two work phases of our generator • Data extraction • Workload generation
Data extraction Data extraction Data generator Summary statistics of subscriber interests, locations, and events
Data extraction (Cont’d) For each cell , • Subscription count • Event count • Distribution of subscribers over the network Event space
Data extraction (Cont’d) • Data from Google Groups • Data from PlanetLab • Our approach can be applied to other data sources that offer similar types of summary information.
Google Groups • Ex: Asian languages -> Eastern Asian languages -> Korean Google defines hierarchies over topics and regions. Tag each group with three attributes.
Google Groups (Cont’d) t7 t6 • Treat topic and language as dimensions of the event space. • Each interest • Pair of topic and language. t5 t4 Interest = (t7, l4) l4 l5 l6 l7 t1 l1 t3 t2 l2 l3 t4 t5 t6 t7 l7 l4 l5 l6 Event space Topic hierarchy Lang hierarchy
Google Groups (Cont’d) • Collect statistical summary for each interest • # messages per month posted to groups associated to that interest. • # members in each group associated with that interest.
Google Groups (Cont’d) • Divide all Google groups associated with the same interest by their geographic regions. • Count #members within each geographic region. • Rough indication of the distribution of subscribers over the network.
Google Groups (Cont’d) For each cell (interest), • Subscription count • Event count • Distribution of subscribers by geographic region Event space
Network Location • Data from Google Groups gives us a rough distribution of subscriptions by geographic regions. • Still need actual network locations. Google Groups PlanetLab nodes Geographic regions Coordinates • PlanetLab nodes • IP-address • Embed inter-node latencies in a low-dimensional Euclidean space [Dabek et al’04, Ledlie et al’02, Ng et al’02]
Popularities of interests Top three are (business services, English), (small business, English), (consulting, English). By removing the top 24 interests, # members reduces from 8.1 million to 4.3 millon.
Distribution of interests in event space for different geographic regions Simplified Chinese English English Simplified Chinese Super-interest Super-interest Asia US Simplified Chinese English Europe
Two work phases of our generator • Data extraction • Workload generation
Workload generation Skewness parameter Interest generalization parameter Range perturbation parameter Workload size parameter Data extraction Workload generation Summary statistics of subscriber interests, locations, and events A set of range subscriptions A set of events
Workload generation • Interest diffusion • Interest generalization • Categorical-to-range subscription conversion • Workload with different size
Workload generation 200 100 300 10 277.5 187.5 97.5 16.5 10 90 10 10 16.5 16.5 88.5 16.5 • Interest diffusion • Interest generalization • Categorical-to-range subscription conversion • Workload with different size 10 20 100 50 97.5 16.5 25.5 52.5 10 200 30 50 16.5 34.5 52.5 187.5 Event space
Workload generation • Interest diffusion • Interest generalization • Categorical-to-range subscription conversion • Workload with different size Topic hierarchy Language hierarchy
Workload generation • Interest diffusion • Interest generalization • Categorical-to-range subscription conversion • Workload with different size (soccer, Korean)
Workload generation • Interest diffusion • Interest generalization • Categorical-to-range subscription conversion • Workload with different size
Interest diffusion • Popularity of an interest = number of subscriptions in its subtree. • Siblings of an interest are “related.” • Reduce the popularity variance among the silbings. t1 t2 t3 t5 t4 t6 t7
Interest diffusion • Goal • Given a user-specified value p, reduce all popularity variances by a factor of p for all levels of granularity. • Under the following constraints • Total subscription count remains constant. • Popularity of an interest = sum of child popularities. t1 t2 t3 t5 t4 t6 t7
100 200 t7 300 10 500 t3 230 t6 10 90 10 10 t5 10 20 100 50 70 400 t2 t4 10 200 30 50 l4 l5 l6 l7 l2 l3 Subscription count t1 l1 t2 t3 l2 l3 t5 t4 t6 t7 l4 l5 l6 l7 Topic hierarchy Lang hierarchy
100 200 t7 300 10 500 t3 230 t6 10 90 10 10 t5 10 20 100 50 70 400 t2 t4 10 200 30 50 l4 l5 l6 l7 l2 l3 Mean: (500 + 230 + 70 + 400) / 4 = 300 Variance: [(500 – 300)2 + (230 – 300) 2 + (70 – 300) 2 + (400 – 300) 2 ]/4= 26950
100 200 t7 300 10 500 t3 230 t6 10 90 10 10 t5 10 20 100 50 70 400 t2 t4 10 200 30 50 l4 l5 l6 l7 l2 l3 Mean: 57.5 Mean: 300 Mean: 125 Variance: 6768.75 Variance: 26950 Variance: 11425 Goal : Given a user-specified value p, reduce all popularity variances by a factor of p. Mean: 100 Mean: 17.5 Variance: 3750 Variance: 68.75
Old: C1 Old: C2 New: C1* New: C2* t3 Old: C3 Old: C4 t2 New: C3* New: C4* l2 l3 Old mean: C New mean: C* Goal : Given a user-specified value p, reduce all popularity variances by a factor of p.
100 200 t7 300 10 500 t3 230 t6 10 90 10 10 t5 10 20 100 50 70 400 t2 t4 10 200 30 50 l4 l5 l6 l7 l2 l3 Mean: 57.5 Mean: 300 Mean: 125 Variance: 6768.75 Variance: 26950 Variance: 11425 Mean: 100 Mean: 17.5 Proceed top-down from the coarsest level of granularity to the finest level of granularity Variance: 3750 Variance: 68.75
100 200 t7 300 10 500 230 t3 237 480 t6 10 90 10 10 t5 10 20 100 50 70 400 t2 93 390 t4 10 200 30 50 l4 l5 l6 l7 l2 l3 59.25 Mean: 57.5 Mean: 300 120 Mean: 125 Variance: 6768.75 Variance: 26950 21829.5 Variance: 11425 97.5 Mean: 100 Mean: 17.5 23.25 P = 0.81 Variance: 3750 Variance: 68.75
200 t7 100 300 10 500 230 277.5 187.5 97.5 16.5 t3 237 480 t6 10 90 10 10 16.5 16.5 88.5 16.5 t5 10 20 100 50 70 97.5 400 16.5 25.5 52.5 t2 93 390 t4 10 200 30 50 16.5 34.5 52.5 187.5 l4 l5 l6 l7 l2 l3 59.25 Mean: 57.5 Mean: 300 120 Mean: 125 Variance: 6768.75 Variance: 26950 21829.5 Variance: 11425 9254.25 5482.69 97.5 Mean: 100 Mean: 17.5 23.25 P = 0.81 Variance: 3750 Variance: 68.75 3037.5 55.6875
Along the language dimension Before diffusion After diffusion
Along the topic dimension Before diffusion After diffusion
Conclusion and Future work • Make the best out of the limited amount of publicly available information to generate realistic workloads. • Make deviations easy to understand and control by users. • Extensions • Changes to event distributions and subscriptions over time. • Subscriptions beyond multi-dimensional range predicates. • Statistical models.