Download
1 / 29
290 likes | 395 Vues
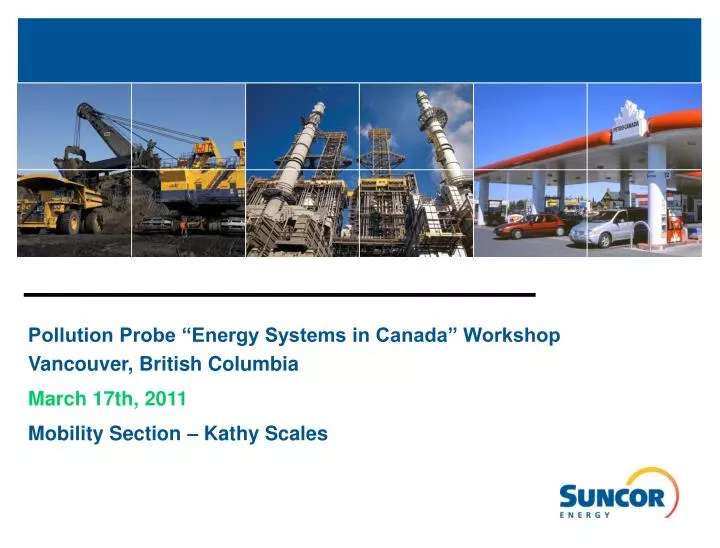
Pollution Probe “Energy Systems in Canada” Workshop Vancouver, British Columbia March 17th, 2011 Mobility Section – Kathy Scales. Our energy system. Oil Biomass Natural Gas Coal Nuclear Renewables. Primary Energy. Power Generation.

E N D
Pollution Probe “Energy Systems in Canada” Workshop Vancouver, British Columbia March 17th, 2011 Mobility Section – Kathy Scales
Our energy system Oil Biomass Natural Gas Coal Nuclear Renewables Primary Energy Power Generation Direct combustion Industry and Manufacturing Liquids Energy Energy Energy Final Energy Mobility Buildings Consumer Choices
Forecasts Show Growing Demand for All Forms of Energy From ExxonMobil’s “2010 The Outlook for Energy: A View to 2030
Global Shifts in Demands Are Under Way From ExxonMobil’s “2010 The Outlook for Energy: A View to 2030”
Oil Sands Perspective: Globally Significant Reserves 87% 13%
……and Reclamation Reclaimed Syncrude Minesite …And Wapisiw Lookout… Formerly Suncor Pond #1 Our Tailings Reduction Operations (TROTM) Technology is Game Changing
Canadian Crude Production and Refineries By The Numbers… Domestic Crude production 158 BL Crude Exports 109 BL Crude Imports 47 BL Refining 99 BL Source: StatsCan 2009 Data • Prince George • Husky • Come By Chance • North Atlantic • Fort McMurray • Suncor Upgrader • St. Romuald • Ultramar • Lloydminster • Husky • Edmonton • Imperial • Shell • Suncor • Regina • Co-op • Burnaby • Chevron • Dartmouth • Imperial • Montreal • Suncor • Saint John • Irving • Sarnia • Imperial • Shell • Suncor • Nanticoke • Imperial Canada is also a Net Exporter of Refined Products
Canada is a Major Exporter Crude Oil Supply and Disposition Western Canada Crude Prod’n 2300 kbopd ~500 kbopd ~300 kbopd ~200 kbopd International Imports ~100 kbopd ~1200 kbopd ~300 kbopd
Crude and Product Supply – British Columbia Focus Crude Movement Terminal Product Movement Refinery Crude Production Hibernia, Terra Nova, White Rose Vancouver Europe Mexico, Venezuela, North Sea US Markets Toronto Seattle British Columbia imports two thirds of its petroleum product requirements. Product demand is met by local refineries, Trans Mountain Pipeline, & imports from the U.S. and Offshore
GHG’s by country Other 3% Oil Sands 5% Canada 2% Agriculture 8% Buildings 11% Transportation 25% Other21% UnitedStates22% Electricity Generation 17% Australia 1% Oil & Gas 17%(excluding oil sands) Japan 4% India 4% China20% Industrial 14% Eurasia9% Europe17% Why transportation emissions? Canada’s GHG by sector
Transportation GHG’s – 3 Parts to the Equation Three Critical Components are Responsible for GHG Emissions from Transportation; any plan to reduce GHGs must incorporate: • Carbon Intensity of the Fuel • Fuel Economy of Vehicles • Total Fuel Consumed (Demand, or Vehicle Miles Travelled)
Up to 80% of the life cycle GHG emissions from petroleum fuels comes from the combustion of the fuel Distribution & retail 2% An Overview of Transportation Fuel Greenhouse Gas Emissions Combustion ~ 80% Refining 10 % Crude Production 8 % Well to Tank Total 20% - 30% of Life Cycle GHGs Tank to Wheel 70% - 80% of Life Cycle GHGs
Auto Manufacturing Sector Challenges for New Technologies To be successful, new automotive technologies must • Be transparent to the user • Be as reliable and as durable as current vehicles • Offer consistent performance • Offer value For positive environmental impact, must also • Sell in mass market quantities A significant and growing percentage of customers indicate a willingness to buy an environmentally friendly vehicle IF and ONLY IF all other attributes are Equal or Better Most customers are unwilling to accept compromises for the sake of new technology or environmental benefit * From polling conducted by Toyota Canada
Development of “unconventional” fuels is critical to meet demand
The Lower Mainland has the ‘Perfect Storm’ of : location, traffic congestion, volume, distance & hydro power BC’s geography is well suited to EV’s, with population density in urban areas with short average trips (59% live in the Lower Mainland) • Travel distances in the Lower Mainland: • 76% of commutes outside of downtown Vancouver are less than 10 km • 61% of trips originating from downtown are less than 10 km • Only 3-6% of trips driven in Vancouver exceed 30 km • Source: City of Vancouver, BC Stats See also: “Unlocking the Electric Mobility Potential of Toronto” Oct 2010 Pollution Probe publication
Which Vehicles And Fuels Will Dominate The Fleet Of The Future? Electricity generation? Solar? Wind? Hydrogen (Fuel Cells)? CNG? Battery exchange? Methanol? Gasoline Hybrids? Battery Recharging? Propane? Plug-ins? E85? Flex Fuel Vehicles? More Biofuels? Diesel? Diesel Hybrids? The challenge – Our challenge - is in ensuring that all participants (Consumers, Oil companies and Vehicle Manufacturers) understand the role they play in moving Canada to a lower carbon future
Questions? Kathy Scales kscales@suncor.com (403) 296 6033 www.suncor.com
The Refining Process Matches Crude Types With Market Demands Gasoline 20-30% Gasoline 5-15% Low Sulphur Gasoline 40-45% Distillate 20-25% Distillate 25-35% Asphalt/ Heavy Fuel Oil 60-75% Ultra Low Sulphur Distillate 35-40% Heavy Fuel Oil 35-55% Heavy Fuel Oil ~6% Asphalt ~3% Other ~10% Light CrudeProductComposition Heavy CrudeProductComposition CanadianProduct Demand (StatsCan)
And Wapisiw Lookout…Formerly Suncor Pond #1 Our Tailings Reduction Operations (TROTM) Technology is Game Changing
Canada is a Major Oil Exporting Nation Natural Gas Supply and Disposition Total Cdn Production 485 MM m3/d WCSB Prod’n 473 MM m3/d Total Cdn Consumption 226 MM m3/d E Coast Offshore Prod’n 12 MM m3/d Imports 26.4 MM m3/d
Biofuels – their place in the fuel mix Current mandates in Canada: Ethanol: 5% average, up to 10% blend of ethanol in gasoline BioDiesel: 2% biodiesel blend • Energy content (density) vs fossil fuel based • Food for fuel debate • Consumer education – current vehicles can use up to 10% ethanol, but not 15%, potentially leading to vehicle warranty issues • Cold weather concerns for biodiesel
A large Gap exists between projected emissions and Canada’s 2020 Goal of 17% below 2005 levels. Addressing transportation sector emissions is complex and multi-dimensional. • Environment Canada’s GHG Forecast • Transportation sector emissions forecast to grow from 122 Mt in 1990 to 194 Mt in 2030
NRTEE Action Wedges for a 60% reduction in Canadian GHGs by 2050 Trend 1¾% for 45 years = +115% The SOLUTIONS Target is - 60% = 240 mT NRTEE: National Round Table on the Environment and the Economy
Wells to Wheels GHG Emissions – Combustion Emissions do not vary