Download
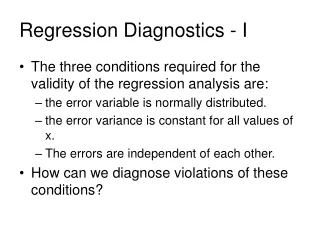
1 / 33
330 likes | 647 Vues
Diagnostics I. Mark Rodwell. Meteorological Training Course Predictability, Diagnostics and Extended-Range Forecasting. ECMWF. 9 May 2012. Talk outline. Aspects of diagnostics The need for diagnostics research Seamless diagnostics Equatorial wave diagnostics. Aspects of diagnostics.

E N D
Diagnostics I Mark Rodwell Meteorological Training Course Predictability, Diagnostics and Extended-Range Forecasting ECMWF 9 May 2012
Talk outline • Aspects of diagnostics • The need for diagnostics research • Seamless diagnostics • Equatorial wave diagnostics
Aspects of diagnostics • Understanding the circulation Lorenz Energy Cycle • Understanding casestudies The October Storm • Understanding error • (observation, analysis or forecast error) Radiosonde first-guess departures
The need for diagnostics research Temporal variance of D+1 error of Z500 • Error identification Total wavenumber From Adrian Simmons
The need for diagnostics research • Error identification Number of observations assimilated (106 day-1) • Observation volume From Peter Bauer and Jean-Noel Thepaut
The need for diagnostics research • Error identification Physical processes represented in the IFS model • Observation volume • Model complexity From Peter Bechtold
The need for diagnostics research • Error identification • Observation volume Met Office rainfall radar 2009/11/29 at 10:30 Met Office rainfall radar 2009/11/29 at 10:30 Met Office rainfall radar 2009/11/29 at 10:30 Met Office rainfall radar 2009/11/29 at 10:30 Met Office rainfall radar 2009/11/29 at 10:30 Met Office rainfall radar 2009/11/29 at 10:30 • Model complexity • ‘Gray-zone’ resolution TL96 TL799 TL256 TL2047 TL511 TL1279
The need for diagnostics research • Error identification m2s-1 Shading: spread Ψ250 D+4 • Observation volume • Model complexity mm • ‘Gray-zone’ resolution Shading: RMSE Ψ250 D+4 • Uncertainty estimation Contours: analysed Ψ250. Squares:obs. precip.
The need for diagnostics research • Error identification • Observation volume • Model complexity AMSRE ch7 (~q850) Variational Bias Correction JJA 2010 • ‘Gray-zone’ resolution • Uncertainty estimation • 4D-Var: obsvs model
T500 forecast error as function of lead-time D+1 D+2 x0.01K x0.1K D+5 D+10 x0.1K x0.1K Based on DJF 2007/8 operational analyses and forecasts. Significant values (5% level) in deep colours.
Data assimilation: Perfect model Mean Analysis Increment = 0 (Imperfect, unbiased observations)
Data assimilation: Imperfect model Mean Analysis Increment ≠ 0 −Mean Analysis Increment = Mean Net Initial Tendency (“I.T.” in, e.g., Kcycle-1) = Mean Convective I.T. + Mean Radiative I.T. + … + Mean Dynamical I.T. (summed over all processes in the model)
Confronting models with observations UNIT=0.01K D+1 T500 FORECAST ERROR T500 ANALYSIS INCREMENT • Every 1o square has data every cycle • ~6 Million data values • Independent vertical modes of information: • IASI / AIRS: ~ 15 • HIRS / AMSUA: ~ 5 (~ 2 IN TROP) • Anchors (not bias corrected): • Radiosonde • AMSUA-14 • Radio Occultation AIRS CH 215 OBS-FIRST GUESS Based on DJF 2007/8 operational analyses and forecasts. Significant values (5% level) in deep colours. AIRS CH 215 BRIGHTNESS TEMPERATURE ~T500
Parameter Uncertainties in Climate Sensitivity MANY UNCERTAINTIES ARE ASSOCIATED WITH “FAST PHYSICS”. … WHICH IS ALSO IMPORTANT IN NWP Representative selection of parameters and uncertainties used by Murphy et al., 2004: Nature, 430, 768-772.
Amazon January 2005 initial T tendencies PERFECT MODEL (Almost!) IMPERFECT MODEL (12K Warming) ( Net = Minus the mean analysis increment ) Reduced Entrainment model is out of balance. Reject or down-weight? Amazon = [300oE-320oE, 20oS-0oN]. Mean of 31 days X 4 forecasts per day X 12 timesteps per forecast. 70% confidence intervals are based on daily means. CONTROL model = 29R1,T159,L60,1800S.
Vertically integrated absolute net tendencies CONTROL ENTRAIN/5 T (Kday-1) q (kgm-2day-1) Can be the basis for a “process metric” (as opposed to the more widely used circulationmetrics) Mean of 31 days X 4 forecasts per day X 12 timesteps per forecast. Mass-weighted vertical integrals. CONTROL model = 29R1,T159,L60,1800S.
Old and New Aerosol Optical Thickness OLD (NO ANNUAL CYCLE) OPTICAL DEPTH d AT 550nm NEW (JULY) ATTENUATION FACTOR = e-d SINGLE SCATTERING ALBEDO FOR DESERT AEROSOL ≈ 0.9 • SOIL DUST IS LARGE COMPONENT • SOIL DUST ABSORBS AS WELL AS SCATTERS Old: C26R1 (Tanre et al. 1984), New: C26R3 (Tegen et al. 1997).
JJA Precipitation, v925 and Z500. New-Old mm day-1. 10% Sig.
North Africa Jul 2004 T Tendencies (New-Old) RADIATIATION CHANGES DESTABILISE PROFILE AND LEAD TO MORE CONVECTION … … BUT ULTIMATELY LEAD TO MORE DESCENT AND LESS OVERALL PRECIPITATION North Africa = [5oN-15oN, 20oW-40oE]. Mean of 31 days X 4 forecasts per day X 12 timesteps per forecast. 70% confidence intervals are based on daily means. CONTROL model = 29R1,T159,L60,1800S.
CONVECTION (FAST RESPONSE) DYNAMICS (SLOW RESPONSE) DRYING Local Response to Aerosol Reduction RADIATION IMPORTANCE OF SEMI-DIRECT EFFECT(?) LESS ABSORPTION
Tropical Waves: Outgoing Long-wave Radiation AUG AUG WESTWARD PROPAGATING WAVES MADDEN-JULIAN OSCILLATION: EASTWARD PROPAGATING, 30-60 DAY (≈10ms-1) JUL JUL MJO JUN JUN 100oW 0o 100oE 7.5oS-17.5oN 5oS-5oN 2006 Wm-2 TIME 100oW 0o 100oE LONGITUDE Data from NOAA
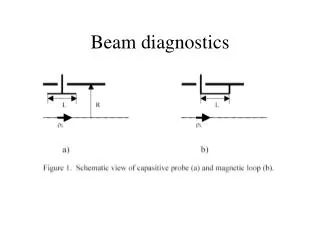
Equatorial Waves (Use of the shallow water equations on the β-plane (f=βy) for understanding tropical atmospheric waves) Momentum: (1) Continuity: v1 u1 u1 (2) v1 Solving for v: (3) Note: No coupling with convection in this model
Limiting solutions η & v η tendency Phase speed Kelvin waves: v≡0, u in geostrophic balance with meridional pressure gradient Equator Gravity waves: Fast, pressure gradient force dominates Rossby waves: Slow, Coriolis affect important, closer to geostrophic balance, less convergence. Take curl of (1)
Free Equatorial Waves V=0: V≠0: Structures (Meridional structures are solutions to Schrodinger’s simple harmonic oscillator) Dispersion (How phase speed is related to spatial scale) East propagating Kelvin Wave • Non-dispersive • In geostrophic balance Substitute into equation for v Hermite Polynomials: Hn(y) • Each successive polynomial has one more node • Modes alternate asymmetric / symmetric about equator For n ≠0: 3 values of ω for each k • West propagating Rossby Wave • E & W propagating Gravity Wave For n=0: 2 values of ω for each k • E & W prop. Mixed Rossby-Gravity (Gravity: associated with first two terms on lhs, Rossby: with last two terms on lhs, Mixed: all three terms)
Interpretation of Free Equatorial Waves Dispersion Diagram SUGGESTS METHOD OF COMPARISON BETWEEN OBSERVATIONS AND MODEL
Wave Power OLR DJF 1990-05 NOAA & 32R3 MJO CONVECTIVELY COUPLED(?) ALIASING OF 12H OBSERVATIONS TOO MUCH LOW FREQUENCY POWER (a) Observed Symmetric (b) Observed Asymmetric KELVIN c≈20ms-1 MIXED ROSSBY ROSSBY (c) Simulated Symmetric (d) Simulated Asymmetric n=-1 n=0 n=1 n=2 n=3 AGREEMENT WITH SHALLOW WATER THEORY IF OLR IS A “SLAVE” TO THE FREE WAVES, LINEARITY ETC.
Gill’s steady solution to monsoon heating • GOOD AGREEMENT WITH THE AEROSOL • CHANGE RESULTS (OPPOSITE SIGN): • NORTH ATLANTIC SUBTROPICAL ANTICYCLONE • CONVECTIVE COUPLING IN KELVIN WAVE REGIME DAMPING/HEATING TERMS TAKE THE PLACE OF THE TIME DERIVATIVES EXPLICITLY SOLVE FOR THE X-DEPENDENCE Colours show perturbation pressure, vectors show velocity field for lower level, contours show vertical motion (blue = -0.1, red = 0.0,0.3,0.6,…) Following Gill (1980). See also Matsuno (1966)
JJA Precipitation, v925 and Z500. New-Old The Extratropical Response will be explained in the next lecture! mm day-1. 10% Sig.
Summary • Aspects of diagnostics • Understanding: the circulation, case-studies, error • The need for diagnostics research • Smaller errors, more observations, model complexity, gray-zone, uncertainty, model vs observation • Seamless diagnostics • Errors that grow are likely to be model problems • Initial tendencies highlight root causes before process interactions • Process-oriented metrics for climate models • Equatorial wave diagnostics • Natural modes of tropical variability • Good way to understand error and uncertainty