Download
1 / 28
280 likes | 480 Vues
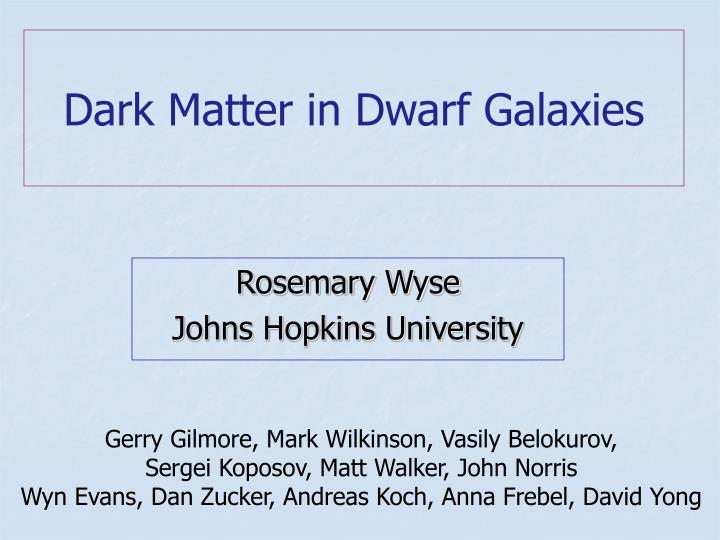
Dark Matter in Dwarf Galaxies . Rosemary Wyse Johns Hopkins University. Gerry Gilmore, Mark Wilkinson, Vasily Belokurov, Sergei Koposov, Matt Walker, John Norris Wyn Evans, Dan Zucker, Andreas Koch, Anna Frebel, David Yong . The Smallest Galaxies as Probes of Dark Matter

E N D
Dark Matter in Dwarf Galaxies Rosemary Wyse Johns Hopkins University Gerry Gilmore, Mark Wilkinson, Vasily Belokurov, Sergei Koposov, Matt Walker, John Norris Wyn Evans, Dan Zucker, Andreas Koch, Anna Frebel, David Yong
The Smallest Galaxies as Probes of Dark Matter and Early Star Formation: • Spatial distribution of stars limits dark matter scale length • Implies minimum scale length of dark matter, suggests not CDM • Motions of stars constrain (dark) matter density profile • Most straightforward analysis all have similar dark matter halos, with cores not cusps, suggests not standard CDM • Densities imply form at redshifts ~ 10, reionization? • All contain old stars • Velocity dispersions & masses for the ‘ultra-faint’ systems uncertain • Full distribution function modelling for luminous dwarfs: large samples • Astrophysical constraints: • Chemical abundances of dwarf galaxies show trends, not consistent with severe tidal stripping as in CDM models • Fossil record constrains `feedback’ – each dwarf galaxy has own star formation history, but similar dark halo • Elemental abundances: invariant massive-star IMF • Targets for indirect detection
Field of Streams(and dots) Belokurov et al (inc RW, 2006) Segue 1 Boo I Outer stellar halo is lumpy: but only ~15% by mass (total mass ~ 109M) and dominated by Sgr dSph stream SDSS data, 19< r< 22, g-r < 0.4 colour-coded by mag (distance), blue (~10kpc), green, red (~30kpc)
~ 109L ~ 107L ~ 103L Self-gravitating Star clusters Dark matter, galaxies Update from Gilmore et al 07 Add ~20 new satellites, galaxies and star clusters - but note low yield from Southern SEGUE/SDSS imaging : only Segue 2 and Pisces II as candidate galaxies 3/8 area (Belokurov et al 09,10)
Norris, RW et al 2010 Wide-area spectroscopy | | | | | | | | | Red: Segue 1 Black: Boo I Geha et al • Members well beyond the nominal half-light radius in both • Stars more iron-poor than -3 dex exist in both • Extremely rare in field halo, membership very likely • Very far out, parameters and velocity confirmed by follow-up: Segue 1 is very extended! • Both systems show a large spread in iron • Implies dark halo for self-enrichment (cf Simon et al 2010) • Caveat: Segue 1 in complex part of Galaxy: higher metallicity stars?
From kinematics to dynamics: Jeans equation, then full distribution function modelling Jeans equation relates spatial distribution of stars and their velocity dispersion tensor to underlying mass profile Either (i) determine mass profile from projected dispersion profile, with assumed isotropy, and smooth functional fit to the light profile Or (ii) assume a parameterised mass model M(r) and velocity dispersion anisotropy β(r) and fit dispersion profile to find best forms of these (for fixed light profile) beware unphysical models! Jeans’ equation results allow objective comparisons among galaxies: isotropy is simplest assumption, derive mass profile Latter only possible for large sample sizes more luminous dSph, now Mass-anisotropy degeneracy
Gilmore et al, inc RW 2007 Mass density profiles: Jeans’ equation with assumed isotropic velocity dispersion: All consistent with cores(independent analysis agrees, Wu 07, plus gas-rich systems, Oh et al 08) CDM predicts slope of −1.2 at 1% of virial radius, asymptotes to −1 (Diemand et al. 04) as indicated in plot • These Jeans’ models are to provide the most objective comparison among galaxies, which all have different baryonic histories and hence expect different ‘feedback’
Enclosed mass Gilmore RW et al 07; Mateo et al 93; Walker et al 07, 09; Strigari et al 08 Very dark-matter dominated. Constant mass within optical extent for more luminous satellite galaxies.
Extension to lowest luminosities: Strigari et al 2008 • Blue symbols: ‘classical’ dSph, velocity dispersion • profiles to last modelled point, reproduces earlier results • Red symbols: Ultra-faint dSph, data only in central • region, extrapolation in radius by factor of up to 10 • reflects approximately constant velocity dispersions (Walker et al, Wolf et al)
Beware underestimated errors….and non-members Koposov et al 2011 Wil 1 not a bound system (? Geha)
Getting the most from Flames on VLT: Bootes-I sample, 12 x 45min integrations ~1 half light radius FOV, 130 fibres . Koposov, et al (inc RW), submitted Retain full covariance: map spectra models onto data, find ‘best’ match log(g),[Fe/H], T_eff, with a Bayesian classifier. Black: data r=19; red=model 37 members, based on Velocity, [Fe/H], log g Literature value
Very large samples with precision kinematics now exist, motivating full velocity distribution function modeling, going beyond moments Walker et al, Gilmore et al Members: Fornax: 2737 Sculptor: 1368 Sextans: 441 Carina: 1150 Plus new VLT Yield: Car, Sext ~50% For, Scl ~80% Non-members: Wyse et al 2006
Comparing models with kinematic data Surface brightness profile input, determined from data Two-integral velocity distribution function models Invert integral equation for stellar density profile as a function of the potential to find all DFs consistent with observed data Project to obtain LOS velocity distribution on a grid of R and v los Generalized Hernquist/NFW halo (Zhao 1996) Parameters: 3 velocity distribution parameters (anisotropy, scale), 5 halo parameters & 5 stellar parameters (density profiles) Markov-Chain-Monte-Carlo, scan 13-parameter space Multiple starting points for MCMC used - chains run in parallel and combined once “converged” Error convolution included - using only data with Many tests carried out e.g. effects on models of ignored triaxiality, tides, uncertainty in surface brightness profile etc Wilkinson
Fornax: real data - PRELIMINARY density profile Log ρ (M/kpc3) Log r (kpc) • 3 MCMC chains combined: total of ~5000 models • At radii where most of data lie, clear constraints on profile • Inner regions uncertain, few stars observed • Mass profiles are now/soon being derived from kinematics
Main Performances and Capabilities Accuracies: 20 as at V = 15 0.2 mas at V = 20 radial velocities to <10 km/s complete to V ~ 17.5 sky survey at ~0.2 arcsec spatial resolution to V = 20 multi-colour multi-epoch spectrophotometry to V = 20 dense quasar link to inertial reference frame Capabilities: 10 as 10% at 10 kpc (units=pico-rads) [~1cm on the Moon] 10 as/yr at 20 kpc 1 km/s at V=15 every star Gaia will see, Gaia will see move GAIA will quantify 6-D phase space for over 300 million stars, and 5-D phase-space for over 109 stars
Construct line of sight velocity distributionsMCMC comparison to data • Fit surface brightness profile • Use method by P. Saha to invert integral equation for all DFs consistent with observed ρ where • Project to obtain LOS velocity distribution on a grid of and • convolve with individual velocity errors, and compare to data (MCMC)
Going beyond velocity moments • More general halo profile: • 2-integral distribution functions F(E,L) constructed using scheme of Gerhard; Saha • Models projected along line of sight and convolved with velocity errors • Data analysed star-by-star: no binning
2-Integral Distribution function Gerhard (1991)
Fornax - dispersion profile NB: Dispersion data not used to constrain models
Fornax - dispersion profile NB: Dispersion data not used to constrain models
Draco: Okamoto 2010, PhDCarina: Monelli et al 2003 1Gyr 5Gyr 12Gyr Luminous dSph contain stars with a very wide age, varying from systems to system, but all have old stars: ancient, stable. Extended, very low star formation rates Minimal feedback
Tests with spherical models Cusp Core Log ρ (M/kpc3) Log ρ (M/kpc3) Log r (kpc) Log r (kpc) • Artificial data sets of similar size, radial coverage and velocity errors to observed data set in Fornax • Excellent recovery of input profiles (solid black), even in inner regions; green dashed is most likely, black dashed enclose 90% confidence limits
Tests with (anisotropic) triaxial models Cusp Core Log ρ (2e5 M/kpc3) Log ρ (2e5 M/kpc3) Log r (kpc) Log r (kpc) • Axis ratios 0.6 and 0.8, similar to projected 0.7 of Fornax dSph; ~2000 velocities, to match data • Models have discriminatory power even when modelling assumptions not satisfied
ΛCDM cosmology extremely successful on large scales. Galaxies are the scales on which one must see thenature of dark matter: Ostriker & Steinhardt 03 Inner DM mass density depends on the type(s) of DM Galaxy mass function depends on DM type
Full velocity distribution functions:breaking the anisotropy-mass profile degeneracy Analyse velocities star-by-star, no binning Abandon Jeans Different radial velocity distribution Same dispersion profile
Dark-matter halos in ΛCDM have ‘cusped’ density profiles ραr -1.2 in inner regions Diemand et al 2008 Test best in systems with least contribution to mass from baryons : dwarf spheroidal galaxies Main halo Sub-halos Lower limits here