Download
1 / 23
230 likes | 360 Vues
s. OSAV’2004 International Topical Meeting. Toward A Calibrated LIF Image Acquisition Technique For In-Cylinder Investigation Of Air-to-fuel Mixing In Direct Injection Gasoline Engines. G. De Sercey, G. J. Awcock and M. Heikal University of Brighton School of Engineering UK

E N D
s OSAV’2004 International Topical Meeting Toward A Calibrated LIF Image Acquisition Technique For In-Cylinder Investigation Of Air-to-fuel Mixing In Direct Injection Gasoline Engines G. De Sercey, G. J. Awcock and M. Heikal University of Brighton School of Engineering UK G.J.Awcock@brighton.ac.uk This Work Conducted In Association With Ricardo Consulting Engineers, UK
Toward A Calibrated LIF Image Acquisition Technique For In-Cylinder Investigation Of Air-to-fuel Mixing In Direct Injection Gasoline Engines • Introduction • The Laser Induced Fluorescence (LIF) Technique • The Optical Set-up for Quantitative Measurement • Calibration Strategy • Tracer Optimisation • Calibration Process • Conclusion; - Discussion Of Results
Evolution Of European Emission Standards For Gasoline Engines (2.0 l) Introduction I The Pressure for Better, Cleaner Engines • User Demand • Rocketing Fuel Cost • 1970’s Onwards • Better Economy Is A Selling Point • Imposed Pollution Limits • Widespread Legislation • Manufacturers MUST Develop Cleaner Engines To Continue To Sell Cars! Fuel Injected (PFI) Engines GDI Engines
Intake Port Spark Plug Injector Exhaust Air Flow Bowl-In-Piston Introduction II Gasoline Direct Injection Engine: Injection Directly In The Engine Cylinder • Better Control Over Injection • Less Heat Losses • Lower Consumption • Reduced Emissions • Achieved By Concentrating FuelAround The Spark Plug • Complex Geometry • Complex Air Flow • Complex Air / Fuel Mixing Stratified Mixture
excited electronic state Rotational vibrational transitions LI Emission Fluorescence Quenching (losses) Absorption (Colour shift) ground electronic state Excited molecule (Tracer) Laser light Fluorescence LIF Technique
Qualitative LIF Shows Relative Distribution At A Particular Piston Position, Or Crank Angle (CA) Why Quantitative LIF? • Quantitative LIF • Shows Absolute Distribution At Any Engine Position • Gives Actual Fuel Concentration • Allows Comparison Between Crank Angles • Allows Comparison Between Experiments • No Comparison Between Crank Angles • No Comparison Between Experiments
Optical Set-up I Lens-coupled gated image intensifier Beam dump 532nm ‘filter’ CooledCamera motor Schott filter PC Engine withquartz annulus Sheet forming optics Laser Nd:YAG, 266nm Coated mirror(+ beam monitortap) Shutter
Calibration Strategy Best Practice So Far: Measure Of T & P Dependency In A Pressure Vessel, BUT… Must Compensate For Dependence Of Fluorescence On T & P • Optical Set-up Different From The One Of The Experiment • Unrealistic, As T & P Varies Spatially In The Engine! In-Cylinder Calibration • Same Optical Set-up • No Need To Measure P & T Provided Calibration And Experimental Images Are Acquired At The Same Crank Angle
Exhaust Insulation layer 2’’ ID Pipe Heating tape Ball valve Injection hole Evaporation crucible Intake plenum Intake air Ball valve Engine Calibration Loop
Choice of Tracer Characteristics Sought For The Tracer • Absorption Wavelength Achievable With A Laser • Enough Fluorescence To Be Detectable With Decent SNR • Low Sensitivity To Quenching • Similarity To Fuel In Term Of Physical And Vaporisation Properties • Non-Hazardous!
Crank Angles What Is Equivalence Ratio? Tracer Optimisation I Test With Pure Acetone Saturation
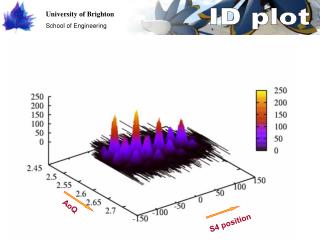
1600 1400 1200 100CA 1000 180CA 280CA Fluorescence Intensity (a.u) 800 300CA 600 400 200 0 100% 90% 80% 70% 60% 50% 40% 30% 20% 10% 0% Acetone Concentration Tracer Optimisation II Test With Various Acetone Concentrations In Iso-Octane Optimum Between 2 And 10%
Calibration Process Overview • Engine Motored In Closed-Loop Mode • Calibration Images Acquired (For Each CA And Equivalence Ratio) And Processed To Extract Average Intensity • Average Intensities Plotted And Piece-Wise Linear Fitted • Calibration Look-Up-Table (LUT) Generated • Engine Motored In Normal Mode • Fuel Mixing Experiments Performed & Images Acquired • (Error Images Derived, At Each CA, Mid-Term, BUT In Closed Loop Mode) • Error Image Corresponding To The Same CA Subtracted • Calibration Map Applied Quantitative Air-to-Fuel Ratio Maps
Error Image Raw Experiment Image - Calibration Corrected Image Calibration Process Summary Error Subtraction Quantitative Data
Qualitative LIF Shows Relative Distribution At A Particular Crank Angle Review; - Why Quantitative LIF? • Quantitative LIF • Shows Absolute Distribution At Any Engine Position • Gives Actual Fuel Concentration • Allows Comparison Between Crank Angles • Allows Comparison Between Experiments • No Comparison Between Crank Angles • No Comparison Between Experiments
Quantitative Results I Equivalence Ratio Scale:
Quantitative Results II • Crank-Angle Compensation Allows Valid Fuel Mixing Studies To Be Conducted Over All Relevant Crank Angles • A Range of Injection Strategies (At 1500 RPM) • Start of Injection (SoI) At 0.5º, 30º, 60º ATDC • A Range of Engine Speeds (At SoI 60º ATDC) • 1500, 1000, 500 RPM Uncalibrated Fluorescence Calibrated Fluorescence; - Equivalence Ratios
Qualitative LIF Shows Relative Distribution At A Particular Crank Angle Review; - Why Quantitative LIF? • Quantitative LIF • Shows Absolute Distribution At Any Engine Position • Gives Actual Fuel Concentration • Allows Comparison Between Crank Angles • Allows Comparison Between Experiments • No Comparison Between Crank Angles • No Comparison Between Experiments
Quantitative Results III Comparison With Dynamic Flow Visualisation Rig (DFVR) • DFVR Is A PIV Technique Using Water Seeded With Particles To Visualise Flow • LIF And DFVR Results Are Compared At The SAME Crank Angle • Good Correspondence • Rich Mixture (1.2<Φ<1.8) On Exhaust Side • Carried With Flow Out Of Bowl • Lean (Φ<0.5) On Intake Side • Dilution By High Velocity Air From Open Intake Valve Mixture Distribution at 90º CA For A SoI At TDC, With Superimposed DFVR Air-Flow Predictions
Injection at 30CA Injection at TDC Injection at 60CA 25% 10% 0% Quantitative Results VI • Coefficient of Variation (CoV) Can Be Determined To Study Stability Of The Mixing Process • CoV Is The Image RMS Difference Values Divided By Image Mean CoV Mixture Stability for Various Start of Injection Timings (White = >25%) • These Results Suggest That 30CA Is The Most Stable Scenario • Tests Performed On A Firing Engine Support This Evidence • Injection At 30CA Gives Best Emissions Performance And Minimum ‘Knock’ (Pre-ignition)
Conclusions • A New Strategy Has Been Developed For Calibration of LIF Measurements • Critical To Understanding Air-Fuel Mixing In The Cylinder • It Is Efficient And Realistic • Thanks To Calibration At Full Range Of Equivalence Ratios, Crank Angles And Engine Speeds • It Is Effective • Predictions From Motored Test Engine Give Good Agreement With Independent Investigations