Download
1 / 66
660 likes | 780 Vues
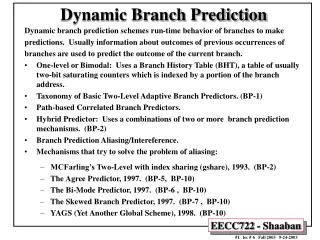
Nonparametric Link Prediction in Dynamic Graphs. Purnamrita Sarkar (UC Berkeley) Deepayan Chakrabarti (Facebook) Michael Jordan (UC Berkeley). Link Prediction. Who is most likely to be interact with a given node?. Should Facebook suggest Alice as a friend for Bob ?. Alice. Bob.

E N D
Nonparametric Link Prediction in Dynamic Graphs PurnamritaSarkar (UC Berkeley) DeepayanChakrabarti (Facebook) Michael Jordan (UC Berkeley)
Link Prediction • Who is most likely to be interact with a given node? Should Facebook suggest Alice as a friend for Bob? Alice Bob Friend suggestion in Facebook
Link Prediction Alice Should Netflix suggest this movie to Alice? Bob Charlie Movie recommendation in Netflix
Link Prediction • Prediction using simple features • degree of a node • number of common neighbors • last time a link appeared • What if the graph is dynamic?
Related Work • Generative models • Exp. family random graph models [Hanneke+/’06] • Dynamics in latent space [Sarkar+/’05] • Extension of mixed membership block models [Fu+/10] • Other approaches • Autoregressive models for links [Huang+/09] • Extensions of static features [Tylenda+/09]
Goal • Link Prediction • incorporating graph dynamics, • requiring weak modeling assumptions, • allowing fast predictions, • and offering consistency guarantees.
Outline • Model • Estimator • Consistency • Scalability • Experiments
The Link Prediction Problem in Dynamic Graphs YT+1 (i,j)=? Y1 (i,j)=1 Y2 (i,j)=0 …… G2 G1 YT+1(i,j) | G1,G2, …,GT ~ Bernoulli(gG1,G2,…GT(i,j)) GT+1 Features of previous graphsand this pair of nodes Edge in T+1
Including graph-based features • Example set of features for pair (i,j): • cn(i,j) (common neighbors) • ℓℓ(i,j) (last time a link was formed) • deg(j) • Represent dynamics using “datacubes” of these features. • ≈ multi-dimensional histogram on binned feature values ηt = #pairs in Gt with these features 1 ≤ cn ≤ 33 ≤ deg ≤ 61 ≤ ℓℓ ≤ 2 high ηt+/ηt this feature combination is more likely to create a new edge at time t+1 cn deg ηt+ = #pairs in Gt with these features, which had an edge in Gt+1 ℓℓ
Including graph-based features 1 ≤ cn(i,j) ≤ 3 3 ≤ deg(i,j) ≤ 6 1 ≤ ℓℓ (i,j) ≤ 2 • How do we form these datacubes? • Vanilla idea: One datacube for Gt→Gt+1aggregated over all pairs (i,j) • Does not allow for differently evolving communities YT+1 (i,j)=? Y2 (i,j)=0 Y1 (i,j)=1 …… G2 G1 GT
Our Model 1 ≤ cn(i,j) ≤ 3 3 ≤ deg(i,j) ≤ 6 1 ≤ ℓℓ (i,j) ≤ 2 • How do we form these datacubes? • Our Model: One datacube for each neighborhood • Captures local evolution Y2 (i,j)=0 YT+1 (i,j)=? Y1 (i,j)=1 …… G2 G1 GT
Our Model 1 ≤ cn(i,j) ≤ 33 ≤ deg(i,j) ≤ 61 ≤ ℓℓ (i,j) ≤ 2 Neighborhood Nt(i)= nodes within 2 hops Features extracted from (Nt-p,…Nt) Datacube Number of node pairs- with feature s- in the neighborhood of i- at time t Number of node pairs- with feature s- in the neighborhood of i- at time t- which got connected at time t+1
Our Model • Datacubedt(i) captures graph evolution • in the local neighborhood of a node • in the recent past • Model: • What is g(.)? g(dt(i), st(i,j)) YT+1(i,j) | G1,G2, …,GT ~ Bernoulli( gG1,G2,…GT(i,j)) Features of the pair Local evolution patterns
Outline • Model • Estimator • Consistency • Scalability • Experiments
Kernel Estimator for g G1 G2 …… { { { { { { { { { { { { { { { { { { { { { { { { { { query data-cube at T-1 and feature vector at time T compute similarities GT-1 GT-2 … … … GT datacube, feature pair t=3 datacube, feature pair t=2 datacube, feature pair t=1
K( , )I{ == } Kernel Estimator for g • Factorize the similarity function • Allows computation of g(.) via simple lookups } } }
Kernel Estimator for g G1 G2 …… compute similarities only between data cubes w1 η1 , η1+ w2 η2 , η2+ GT-1 η3 , η3+ w3 datacubes t=3 datacubes t=2 datacubes t=1 GT-2 η4 , η4+ w4 GT
K( , )I{ == } Kernel Estimator for g • Factorize the similarity function • Allows computation of g(.) via simple lookups • What is K( , )? } } }
Similarity between two datacubes Idea 1 • For each cell s, take(η1+/η1 – η2+/η2)2 and sum • Problem: • Magnitude of η is ignored • 5/10 and 50/100 are treated equally • Consider the distribution η1 , η1+ η2 , η2+
Similarity between two datacubes Idea 2 • For each cell s, compute posterior distribution of edge creation prob. • dist = total variation distance between distributions • summed over all cells η1 , η1+ η2 , η2+ 0<b<1 As b0, K( , ) 0 unless dist( , ) =0
Kernel Estimator for g Want to show:
Outline • Model • Estimator • Consistency • Scalability • Experiments
Consistency of Estimator • Lemma 1: As T→∞, for some R>0, • Proof using: As T→∞,
Consistency of Estimator • Lemma 2: As T→∞,
Consistency of Estimator • Assumption: finite graph • Proof sketch: • Dynamics are Markovian with finite state space • the chain must eventually enter a closed, irreducible communication class • geometric ergodicity if class is aperiodic(if not, more complicated…) • strong mixing with exponential decay • variances decay as o(1/T)
Consistency of Estimator • Theorem: • Proof Sketch: • for some R>0 • So
Outline • Model • Estimator • Consistency • Scalability • Experiments
Scalability • Full solution: • Summing over all n datacubesfor all T timesteps • Infeasible • Approximate solution: • Sum over nearest neighbors of query datacube • How do we find nearest neighbors? • Locality Sensitive Hashing (LSH)[Indyk+/98, Broder+/98]
Using LSH • Devise a hashing function for datacubes such that • “Similar” datacubestend to be hashed to the same bucket • “Similar” = small total variation distance between cells of datacubes
Using LSH • Step 1: Map datacubes to bit vectors Use B1 buckets to discretize [0,1] Use B2 bits for each bucket Total M*B1*B2 bits, where M = max number of occupied cells << total number of cells For probability mass p the first bits are set to 1
Using LSH • Step 1: Map datacubes to bit vectors • Total variation distance L1 distance between distributions Hamming distance between vectors • Step 2: Hash function = k out of MB1B2 bits
Fast Search Using LSH 0000 0001 1111111111000000000111111111000 0011 10000101000011100001101010000 . . . . 1011 10101010000011100001101010000 101010101110111111011010111110 1111111111000000000111111111001 1111
Outline • Model • Estimator • Consistency • Scalability • Experiments
Experiments • Baselines • LL: last link (time of last occurrence of a pair) • CN: rank by number of common neighbors in • AA: more weight to low-degree common neighbors • Katz: accounts forlonger paths • CN-all: apply CN to • AA-all, Katz-all: similar s s
Setup • Pick random subset S from nodes with degree>0 in GT+1 • , predict a ranked list of nodes likely to link to s • Report mean AUC (higher is better) G2 G1 GT Test data Training data GT+1
Simulations • Social network model of Hoff et al. • Each node has an independently drawn feature vector • Edge(i,j) depends on features of i and j • Seasonality effect • Feature importance varies with season • different communities in each season • Feature vectors evolve smoothly over time • evolving community structures
Simulations • NonParamis much better than others in the presence of seasonality • CN, AA, and Katz implicitly assume smooth evolution
Sensor Network* * www.select.cs.cmu.edu/data
Summary • Link formation is assumed to depend on • the neighborhood’s evolution • over a time window • Admits a kernel-based estimator • Consistency • Scalability via LSH • Works particularly well for • Seasonal effects • differently evolving communities
Problem statement • We are given {G1, G2,…, Gt}. Want to predict Gt+1 • Model 1: Yt+1(i,j) = f(Yt-p+1(i,j), …, Yt(i,j)) • Takes all edges as independent • Only looks at one feature. • Model2: Gt+1 = f(Gt-p+1, Gt-p+2,…, Gt) • Huge dimensionality • Probably intractable • Middle ground • Learn local prediction model for Yt+1(i,j) using a few features and patch these together to predict the entire graph.
Our Model • Idea: Yt+1(i,j) depends on features of (i,j) and the neighborhood of i in the ‘’p’’ previous graphs. Features specific to (i,j) in t {deg(i), deg(j), cn(i,j), ℓℓ(i,j)} Features of the neighborhood of i Should be amenable to fast algorithms. Should reflect the evolution of the graph. But should also be similar to the features of (i,j).
Estimation • Kernel Estimator of g } Once you have computed the kernel similarities between two datacubes, everything boils down to table lookups.
Distance between two datacubes • Can just compare rates of link formation, i.e. η+/η, but this does not take into account the variance. • Instead, make a normal approximation to η+/η and look at the total variation distance. As b0, K(dt(i), dt’(i’)) 0 unless D(K(dt(i), dt’(i’)) =0
Distance between two datacubes • Can just compare rates of link formation, i.e. η+/η, but this does not take into account the variance. • Instead, make a normal approximation to η+/η and look at the total variation distance. As b0, K(dt(i), dt’(i’)) 0 unless D(K(dt(i), dt’(i’)) =0
Consistency of Estimator • Define • Kind of behaves like a bias term.
Consistency of Estimator • Show • Assumption 1. b0 as nT∞ [similar to kernel density estimation] • Show that for bounded q, • Assumption 2. Introduce strong mixing coefficient α(k), roughly this bounds the degree of dependence between two neighborhoods at distance k. • The total covariance between all neighborhoods is bounded. • Assume
Including graph-based features 1 ≤ cn(i,j) ≤ 3 3 ≤ deg(i,j) ≤ 6 1 ≤ ℓℓ (i,j) ≤ 2 YT+1 (i,j)=? Y2 (i,j)=0 Y1 (i,j)=1 …… G2 G1 Too local, not to mention expensive Too global. Idea2: Make one datacube for each pair of nodes. Idea1: Make one datacube per (Gt ,Gt+1 ) transition. Learn how successful this feature combination has been in generating links over the past. GT
Our Model 1 ≤ cn(i,j) ≤ 3 3 ≤ deg(i,j) ≤ 6 1 ≤ ℓℓ (i,j) ≤ 2 sT (i,j) • Datacubedt(i)captures the evolution of a small (2-hop) neighborhood around node i • Close nodes will have overlapping neighborhoods similar datacubes. Y2 (i,j)=0 Y1 (i,j)=1 YT+1 (i,j)=? …… G2 G1 GT {dT-1(i) ,sT (i,j)}
Building neighborhood features • Let S=range of s(i,j). Assume S is finite. Datacube Number of pairs with feature s in the neighborhood of i at time t Number of pairs which got connected at time t+1 out of ηit (s) • Captures the evolution of the neighborhood from tt+1 • We use the past evolution pattern of a neighborhood in predicting future evolution. • But how do we estimate g efficiently? We will show that the inference of g will boil down to table lookups in the datacubesdt(i)