Download
1 / 11
130 likes | 301 Vues
Introduction to kriging: The Best Linear Unbiased Estimator (BLUE) for space/time mapping. X ( p ). Realization c (1). Time t. Space s. Realization c (2). X ( p ). Time t. Space s. Definition of Space Time Random Fields. Spatiotemporal Continuum

E N D
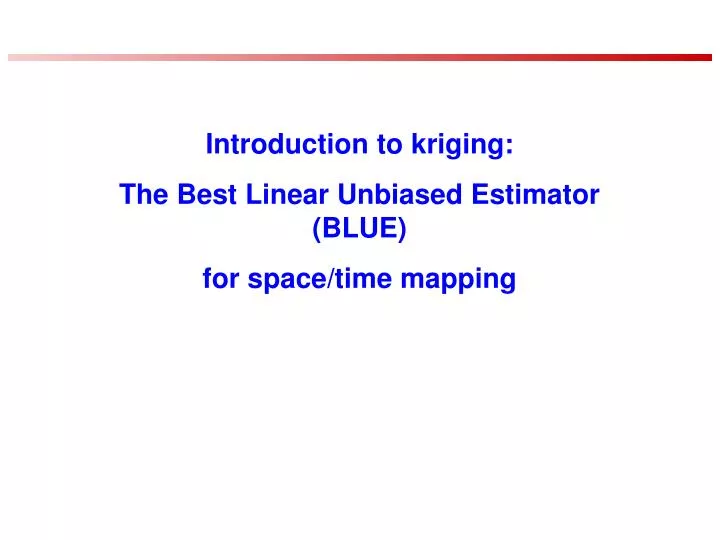
Introduction to kriging: The Best Linear Unbiased Estimator (BLUE) for space/time mapping
X(p) Realizationc(1) Time t Space s Realization c(2) X(p) Time t Space s Definition of Space Time Random Fields • Spatiotemporal Continuum • p=(s,t) denotes a location in the space/time domain E=SxT • Spatiotemporal Field • A field is the distribution c across space/time of some parameter X • Space/Time Random Field (S/TRF) • A S/TRF is a collection of possible realizations c of the field, X(p)={p,c} • The collection of realizations represents the randomness (uncertainty and variability) in X(p)
Multivariate PDF for the mapping points • Defining a S/TRF at a set of mapping points • We restrict Space/Time to a set of nmapping points, pmap=(p1,…, pn) • Each field realization reduces to a set of n values, cmap=(c1,…, cn) • The S/TRF reduces to set of n random variables, xmap= (x1,…, xn) • The multivariate PDF • The multivariate PDF fX characterizes the joint event xmap≈cmap as Prob.[cmap< xmap< cmap+ dcmap] = fX(cmap) dcmap hence the multivariate PDF provides a complete stochastic description of trends and dependencies of the S/TRF X(p) at its mapping points • Marginal PDFs • The marginal PDF for a subset xa of xmap= (xa, xb) is fX(ca) = ∫dcb fX(ca , cb) hence we can define any marginal PDF from fX(cmap)
Statistical moments • Stochastic Expectation The stochastic expectation of some function g(X(p), X(p’), …) of the S/TRF is E [g(X(p), X(p’), …)] = ∫dc1 dc2 ... g(c1, c2 , ...) fX(c1, c2 , ...; p ; p’ , ...) • Mean trend and covariance The mean trend mX(p)=E [X(p)] and covariance cX(p, p’)=E [ (X(p)-m(p)) (X(p’)-m(p’)) ] are statistical moments of order 1 and 2, respectively, that characterizes the consistent tendencies and dependencies, respectively, of X(p)
Homogeneous/Stationary S/TRF • A homogeneous/stationary S/TRF is defined by • A mean trend that is constant over space (homogeneity) and time (stationarity) mX(p) = mX • A covariance between point p =(s,t) and p’ =(s’,t’) that is only a function of spatial lag r=||s-s’|| and the temporal lagt = |t-t’| cX(p, p’)= cX ( (s,t), (s’,t’) )= cX(r=||s-s’|| , t=|t-t’|) • A homogeneous/stationary S/TRFs has the following properties • It’s variance is constant, i.e. sX2(p)=sX2 Proof: sX2(p)= E[(X(p)- mX(p))2] = cX(p, p) = cX( r=0, t=0 ) is not a function of p • It’s covariance can be written as cX(r , t)= E[X(s,t)X(s’,t’)] ||s-s’|| =r, |t-t’| =t- mX2 , This is a useful equation to estimate the covariance
Experimental estimation of covariance • When having site-specific data, and assuming that the S/TRF is homogeneous/stationary, then we obtain experimental values for it’s covariance using the following estimator where N(r,t) is the number of pairs of points with values (Xhead, Xtail) separated by a distance of r and a time of t. • In practice we use a tolerance dr and dt, i.e. such that r-dr ≤ ||shead-stail|| ≤ r+dr and t-dt ≤ ||thead-ttail|| ≤ t+dt
Spatial covariance models • Gaussian model: cX(r) = co exp-(3r2/ar2) • co = sill = variance • ar = spatial range • Very smooth processes • Exponential model: cX(r) = co exp-(3r/ar) • more variability • Nugget effect model cX(r) = co d(r) • purely random • Nested models cX(r) = c1(r) + c2(r) + … • where c1(r), c2(r), etc. are permissible covariance models • Example: Arsenic cX(r) = 0.7sX2exp-(3r/7Km) +0.3sX2exp-(3r/40Km) • where the first structure represents variability over short distances (7Km), e.g. geology, the second structure represents variability over longer distances (40Km) e.g. aquifers.
Space/time covariance models cX(r,t)is a 2D function with spatial component cX(r,t=0) and temporal component cX(r=0,t) • Space/time separable covariance model • cX(r,t) = cXr(r) cXt(t) , where cXr(r)and cXt(t) are permissible models • Nested space/time separable models • cX(r,t) = cr1(r) ct1(t) + cr2(r)ct2(t) + … • Example: Yearly Particulate Matter concentration (ppm) across the US • cX(r,t) = c1 exp(-3r/ar1-3t/at1) + c2 exp(-3r/ar2-3t/at2) • 1st structure c1=0.0141(log mg/m3)2, ar1=448Km, at1=1yearsis weather driven • 2nd structure c1=0.0141(log mg/m3)2, ar1=17Km, at1=45yearsdue to human activities
The simple kriging (SK) estimator • Gather the data chard=[c1, c2, c3 , …]T and obtain the experimental covariance • Fit a covariance model cX(r) to the experimental covariance • Simple kriging (SK) is a linear estimator • xk(SK)= l0 +l Txhard • SK is unbiased • E[xk(SK) ] = E[xk]═► xk(SK)= mk +l T(xhard- mhard) • SK minimizes the estimation variancesSK2 =E[(xk- xk(SK))2] • ∂sSK2 / ∂lT= 0 ═► lT = Ck,hard Chard,hard-1 • Hence the SK estimator is given by • xk(SK)= mk + Ck,hard Chard,hard-1 (xhard. - mhard) T • And its variance is • sSK2=sk2-Ck,hard Chard,hard-1 Chard,k
Example of kriging maps Run Kriging Example introToKrigingExample.m
Example of kriging maps • Observations • Only hard data are considered • Exactitude property at the data points • Kriging estimates tend to the (prior) expected value away from the data points • Hence, kriging maps are characterized by “islands” around data points • Kriging variance is only a function to the distance from the data points • Limitations of kriging • Kriging does not provide a rigorous framework to integrate hard and soft data • Kriging is a linear combination of data (i.e. it is the “best” only among linear estimators, but it might be a poor estimator compared to non-linear estimators) • The estimation variance does not account for the uncertainty in the data itself • Kriging assumes that the data is Gaussian, whereas in reality uncertainty may be non-Gaussian • Traditionally kriging has been implemented for spatial estimation, and space/time is merely viewed as adding another spatial dimension (this is wrong because it is lacking any explicit space/time metric)