Download
1 / 28
290 likes | 398 Vues
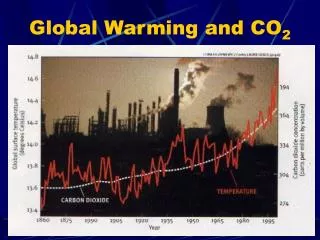
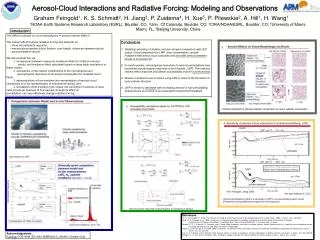
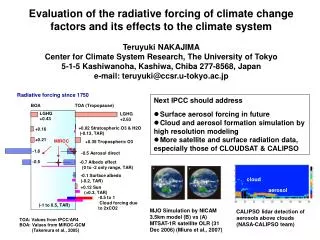
Workshop on common metrics to calculate the CO2 equivalence of anthropogenic greenhouse gas emissions by sources and removals by sinks. Radiative Forcing and Global Warming Potentials due to CH 4 and N 2 O. Hua Zhang Ruoyu Zhang. National Climate Center. China Meteorological Administration.

E N D
Workshop on common metrics to calculate the CO2 equivalence of anthropogenic greenhouse gas emissions by sources and removals by sinks Radiative Forcing and Global Warming Potentials due to CH4 and N2O Hua Zhang Ruoyu Zhang National Climate Center China Meteorological Administration April 3-4, 2012 Bonn, Germany
Outline Backgrounds 1 Data & Methods 2 2 Radiative forcings 3 GWPs& GTPs 4 Discussion 5
CH4 (pptv) C02 (ppmv) N20 (pptv) Backgrounds Concentrationsof main GHGs before 2005 10000 5000 0 year(before 2005)
Backgrounds 气候变化的一种机制 通过辐射传输过程
Methods Radiative forcing (RF)
Time-decaying functions RF of CO2 Radiative efficiency Methods GWP RF of GHG x 1 GWP is related to emission process of GHG; 2GWP can convert any kind of GHG equivalently to CO2 emission, which makes the comparison easily among different gases; 3 GWP denotes the cumulative climate effect of the GHG during a period of time.
Surface temperature changes Methods GTP Tchanges with time T arrives at balance not varying • 1 GTP refers to emission process of GHGs too ; • 2 GTP can convert any kind of GHGs equivalently to • CO2 emission too; • GTP denotes the effect of GHG on the temperature • changes of the earth-atmosphere system.
Model & Data Radiative Transfer Model (Zhang et al., 2003; 2006a,b) • 998-band longwave radiative transfer • scheme(high resolution) • 10~49000cm-1 (0.2~1000µm) is divided into 998 • bands • longwave region 10~2500cm-1(4~1000µm) • is 498bandswith intervals of 5cm-1
Model & Data 辐射传输模式 Gas molecular spectrum data 辐射传输模式 辐射传输模式 辐射传输模式 辐射传输模式 HITRAN2004 Atmosphereprofiles data 6kinds of typical model atmosphere : TRO、MLS、MLW、SAS、SAW、USS Clouds ISCCP D2 products
Criterion: to judge whether the system reaches to balance Iteration to calculate ARF Temperature profile T0(L) kn=0 Radiative Transfer Model (Zhang et al.,2006) Radiative Transfer Model (Zhang et al.,2006) Heating rate for zero concentration: htr0(L) Heating rate for 0.1 ppbvconcentration: htr1(L) iterationkn=kn+1 kn=0 Instantaneous RF Heating rate Htrdif(L)=htr1(L) - htr0(L) htrdif(L)<ξ N Tnew(L)=Told(L)+htrdif(L)×△t L:from Tropopause to TOA Y Adjusted RF
Model tests (1)CO2concentration is doubled from 287 ppmvto 574 ppmv; (2)With doubled CO2 concentration (574 ppmv), H2O content is increased by 20% of its concentration of 1860year
Results Radiative efficiency * unit:W·m-2·ppbv-1 ** Lifetime : CO2 : 120a ; CH4 : 12a ; N2O : 114a
Results Radiative forcings (ARF) * unit:W·m-2 ** Lifetime : CO2 : 120a ; CH4 : 12a ; N2O : 114a
Results Climate sensitivity parameter : λ Its typical value is chosen as 0.5K·(W·m-2)-1 Original concentration of CO2 : 385.2 ppmv Then: IPCC : 1.5~4.5K
Results ARF fittingformula C : CO2concentration; C0 : background CO2 concentration, C0 = 385.2 ppmv; fitting parameters : α=6.2554, β=5.2783×10⁻²
Results 6种大气廓线下 ARF fitting formula CH4background concentration M0=1797ppbv; 0≤M0,N0≤10000 ppbv ; fitting parameters : α=0.03195, β=1.439×10⁻⁴, γ=-1.133×10⁻³, δ=1.221×10⁻⁷ N2O background concentrationN0=321.8ppbv 0≤M0,N0≤10000 ppbv; fitting parameters : α=0.08801, β=0.0011 γ=-3.7167×10⁻⁴, δ= 2.0116×10⁻⁹
Results Test of fitting * Shi et al., absolute error≤0.05 W m-2
Results before atmospheric lifetime adjustment after atmospheric lifetime adjustment
Results For comparison : Shine(2005)results
Results Before atmospheric lifetime adjustment After atmospheric lifetime adjustment
AGTPP of CH4&N2O AGTPS of CH4& N2O
AGTPP of CO2 Temperature changes (10-16K) Temperature changes (10-14K) Time (a) AGTPS of CO2 Time (a)
Discussion The lifetimes of CH4are relatively short-lived GHGs; GWPgreatly over-estimatesthe effects of their pulse emission on climate changes. GTPp is an optimal metric for assessing the long-term effects of CH4 emissions on global climate change, by considering practical emissions of these gases.
Climate sensitivity parameter λ can affect AGWP and AGTP greatly, this should be considered as a large uncertainty in estimating process. • AGWPs and AGTPs of long-lived GHGs are sensitive to time horizon; while AGTPp of short-lived GHGs is sensitive to time horizon greatly. • Clouds is another large factor of uncertainties in estimating GWP or GTP and should be clarified in IPCC AR5 report.