Download
1 / 4
40 likes | 52 Vues
2002. 5 million ha of north-west Namibia. Animals actually seen during the count:. POPULATION ESTIMATES. Population estimates (using statistical analysis alone). Agreed population estimates (using local knowledge and consensus) - these tend to be conservative. TREND:

E N D
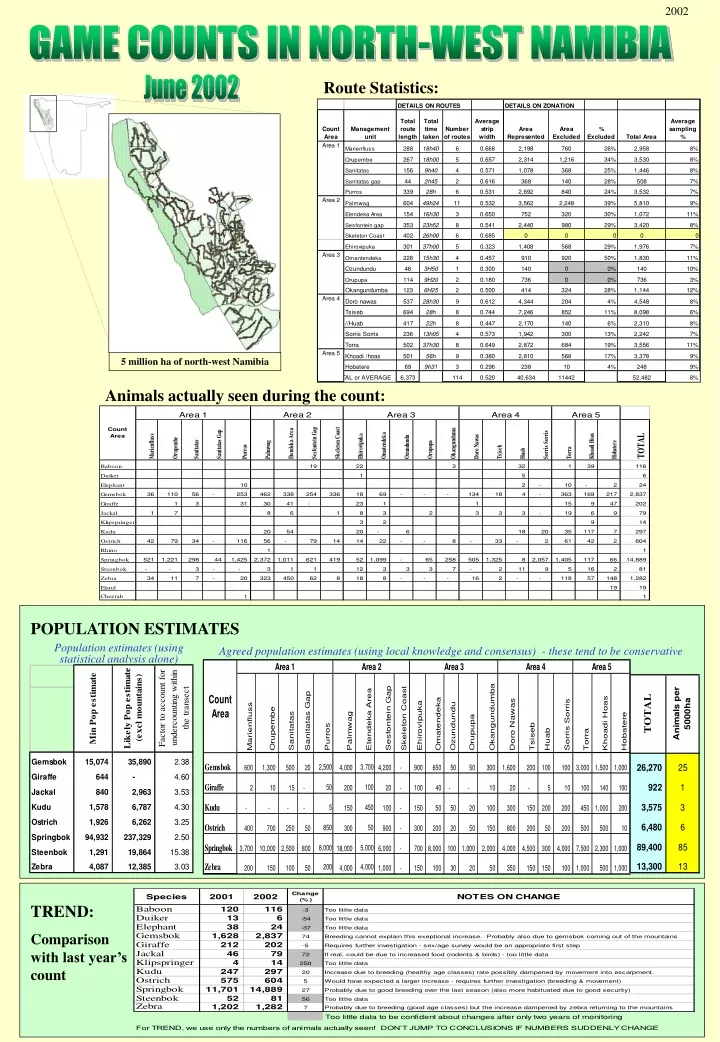
2002 5 million ha of north-west Namibia Animals actually seen during the count: POPULATION ESTIMATES Population estimates (using statistical analysis alone) Agreed population estimates (using local knowledge and consensus) - these tend to be conservative TREND: Comparison with last year’s count GAME COUNTS IN NORTH-WEST NAMIBIA June 2002 Route Statistics:
2003 GAME COUNTS IN NORTH-WEST NAMIBIA Route Statistics: June 2003 Animals actually seen during the count: 5 million ha of north-west Namibia POPULATION ESTIMATES Agreed population estimates for each area (using transect method and consensus) Regional population estimates (using various methods) Total number of animals seen TREND: Comparison with previous years’ counts Number of animals per 100km
2004 GAME COUNTS IN NORTH-WEST NAMIBIA Route Statistics: June 2004 Animals actually seen during the count: 5.2 million ha of north-west Namibia POPULATION ESTIMATES Population estimates for each area (using transect method and consensus) Regional population estimates (using various methods) Total number of animals seen TREND Comparison with previous years’ counts Number of animals per 100km
2005 GAME COUNTS IN NORTH-WEST NAMIBIA Route Statistics: June 2005 Animals actually seen during the count: Population estimates for each area (using individual route zones and consensus) POPULATION ESTIMATES Regional population estimates (using various methods) # This method is not suitable for estimating giraffe. Total number of animals seen TRENDComparison with previous years’ counts Number of animals per 100km