Download
1 / 18
720 likes | 2.13k Vues
Instrumental Analysis. Discuss theory and background for Spectrophotometry Chromatography Electrochemistry signal processing and relationship between readout to property measured. Introduction (Chapter 1). Classification of Analytical Methods

E N D
Instrumental Analysis Discuss theory and background for Spectrophotometry Chromatography Electrochemistry signal processing and relationship between readout to property measured
Introduction (Chapter 1) • Classification of Analytical Methods • Qualitative instrumental analysis is that measured property indicates presence of analyte in matrix • Quantitative instrumental analysis is that magnitude of measured property is proportional to concentration of analyte (species of interest) in matrix (all constituents including analyte. • Matrix-analyte = concomitants(相隨共存物) • Often need pretreatment - chemical extraction, distillation, separation, precipitation……
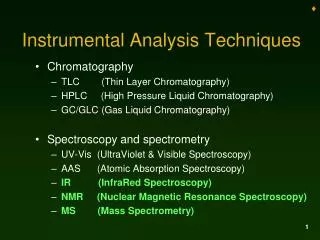
Classification of Analytical Methods • ClassicalQualitative - identification by color, indicators, boiling points, odorsQuantitative - mass or volume (e.g. gravimetric, volumetric) • InstrumentalQualitative - chromatography, electrophoresis and identification by measuring physical property (e.g. spectroscopy, electrode potential)Quantitative - measuring property and determining relationship to concentration (e.g. spectrophotometry, mass spectrometry) • Often, same instrumental method used for qualitative and quantitative analysis
Types of Instrumental Methods: Often combined with chromatographic or electrophoretic methods
Energy stimilus Analyte-matrix Analytical response (transducer) Data process Data out Mono-chromatic light energy Light absorption Photocell Electrical current Meter scale Current meter Basic Components of Instrusment In spectrophotometry, the analytical instrument is spectrophotometer:
Data Domains: way of encoding analytical response in electrical or non-electrical signals. • Interdomain conversionstransform information from one domain to another. • Detector(general): device that indicates change in environment • Transducer(specific): device that converts non-electrical to electrical data • Sensor(specific): device that converts chemical to electrical data
Analog Domains • Analog - continuously variable magnitude current, voltage, charge… • ADC: analog to digital conversion>> data acquisition • DAC: digital to analog conversion>> device control
Digital Domains • Discrete valuescount, serial, parallel, number • Advantages:(1) easy to store(2) not susceptible to noise
Time Domains • Time - vary with timefrequency, phase, pulse width…
Selecting an analytical method • How reproducible? - Precision • How close to true value? - Accuracy/Bias • How small a difference can be measured? - Sensitivity • What range of amounts? - Dynamic Range • How much interference? - Selectivity • How many samples? –Efficience (time, money cost)
Precision • Indeterminate or random errors • Absolute standard deviation: • Variance: s2 • Relative standard deviation: RSD = • Coefficient of variance: CV = % RSD • Standard deviation of mean: sm =
Accuracy • Determinate errors from operator, method, instrumental… • Bias(偏差): μ– x true
Sensitivity • Calibration sensitivity: larger slope of calibration curve m, more sensitive measurement
Detection Limit • Signal must be bigger than random noise of blank • Minimum signal: Signal min = Av. Signal blank + k.Signal blank • From statistics (at 95% confidence level)k = signal/noise >= 3
Dynamic Range • At detection limit we can say confidently analyte is present butcannot perform reliable quantitation • Level of quantitation (LOQ): k = 10 • Limit of linearity (LOL): when signal is no longer proportional to conc. • Dynamic range: LOL / LOQ = 102 to > 106
Selectivity • No analytical method is completely free from interference by concomitants. Best method is more sensitive to analyte than interfering species (interferent). • Matrix with species A&B: Signal = m A c A +m B c B + Signal blank • Selectivity coefficient: k B,A = m B / m A k's vary between 0 (no selectivity) and large number (very selective).