Download
1 / 8
80 likes | 155 Vues
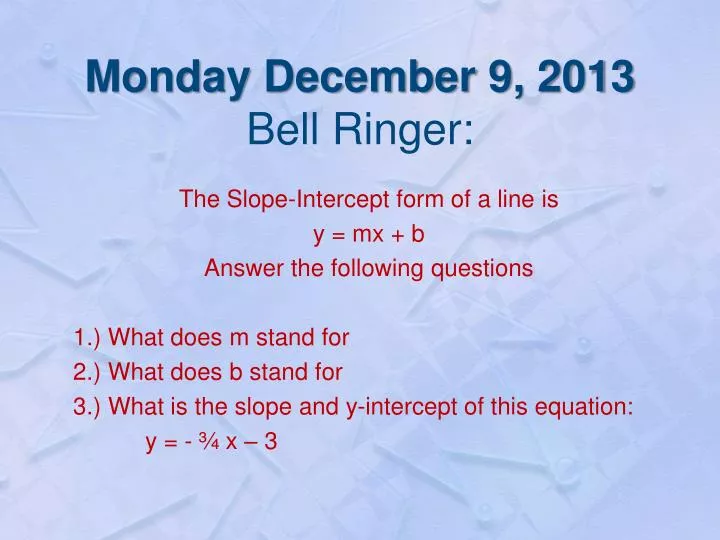
Monday December 9, 2013 Bell Ringer:. The Slope-Intercept form of a line is y = mx + b Answer the following questions 1.) What does m stand for 2.) What does b stand for 3.) What is the slope and y-intercept of this equation: y = - ¾ x – 3. What We are Learning Today:.

E N D
Monday December 9, 2013Bell Ringer: The Slope-Intercept form of a line is y = mx + b Answer the following questions 1.) What does m stand for 2.) What does b stand for 3.) What is the slope and y-intercept of this equation: y = - ¾ x – 3
What We are Learning Today: • To solve linear equations by using: • Tables • Graphs • Equations
A Few Definitions: • Dependent Variable: • Which axis? • Independent Variable: • Which axis?
New Words for What We Know: • Rate of Change: • Constant:
Our Problem: • Alvin’s car rental charges $45 a day to rent a car and a one time fee of $25 for the car’s GPS. Bridget’s car rental charges $30 a day and a fee of $55 for the GPS.
Solve Using Table: What is our rate of change? What is our constant? Equation: How many days is a rental charge of $160 for Alvin’s? When is renting from Bridget’s cheaper?
Practice Time! • Zeno/Apex Worksheet • Remember the y axis is the dependent axis • Label your x and y axis with appropriate numbers • Graph the lines on the same graph • Need at least two points for each line