Download
1 / 108
1.11k likes | 1.31k Vues
GIS and Geologic Mapping Day 2. Tools and methods to get started using GIS geologic mapping USGS Astrogeology GIS Labs. Agenda – Day 2. Query and Spatial Analysis Crater/Feature Tools Freie Universität Berlin ( Kneissl ) /USGS (Nava) Crater density walk-though

E N D
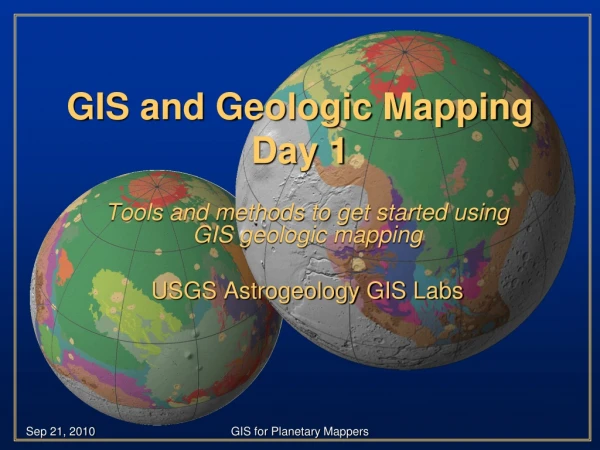
GIS and Geologic MappingDay 2 Tools and methods to get started using GIS geologic mapping USGS Astrogeology GIS Labs
Agenda – Day 2 • Query and Spatial Analysis • Crater/Feature Tools • FreieUniversität Berlin (Kneissl) /USGS (Nava) • Crater density walk-though • Bringing in Data and Setting Projections • Rasters • Shapefiles (interpolation) • ASCII Files (feature lists, gridded rasters) • 3D Viewers Lunch • Creating Figures (Layouts) • GIS Helper Tools • Hawths, Geodesic, USGS Image Tools • ArcMap 10 – what to expect
Querying Spatial data • GIS empowers the user to perform spatial searches across any or all data within a project • A “query” is “a request to select features or records from a database or feature” • Very easy “question-driven” dialog boxes allow user to string together multiple queries • Queries are most easily performed using a dialog box in ArcMap 3 GIS for Planetary Mappers
Suppose in the example below that the user wants to find all units that are labeled “plains material”. The user will need to query the data as follows. GIS for Planetary Mappers 4
Selecting by feature attributes • Select the layer and field that the query will be based on • “Get Unique Values” will give all values in that field • Build the query and click “OK” GIS for Planetary Mappers 6
Selecting by feature location • Features can be selected based on relationships with other features • Examine the “Select by Location” window for specifics GIS for Planetary Mappers 7
Multiple Query for Analysis • “Attribute” and “Location” selection tools and summary tools can be used in series for robust data mining • Crater Count example: “Suppose a user wants to know the total number and summary statistics of craters that have rim diameters between 5 and 16 that reside on Amazonian age geologic units” • Select by attribute from crater database those craters that have diameters between 5 and 16. • Select by attribute from geologic map those units that are Amazonian in age (crater selection will be preserved). • Select by location the selected craters that intersect the selected geologic units. • Summarize crater diameter field. GIS for Planetary Mappers 8
Mars crater count example Crater database Global geologic map GIS for Planetary Mappers
Select layer to query Set selection type Select field Set parameters Select “OK” to run GIS for Planetary Mappers 10
Right-click target layer and select “Open Attribute Table” to verify selection. Note that selected features are highlighted blue Attribute table showing selected features
Do same for geologic unit features… Selected craters Selected units
Note that the pattern of selected features makes sense for the requested query. Good error check. Good for figure, etc. Right-click target features (craters) and “Show Attribute Table” Right-click on target field (diameter) and click “Statistics”
Statistics only computed for selected features. Summary: There 26,652 impact between 5 and 16 km rim diameter. Of those, 2291 occur on Amazonian geologic units. These average 8.3 km in diameter and have a standard deviation of 2.9 km. GIS for Planetary Mappers 15
Calculating Spatial Statistics • A powerful tool to calculate statistics of a zone dataset (e.g., geologic units) based on values from a raster dataset (e.g., elevation) • Spatial Analyst • Cell statistics • Neighborhood statistics • Zonal statistics – covered here • Operates out of Spatial Analyst • Right click empty space on tool bar and select “Spatial Analyst” GIS for Planetary Mappers 16
Zonal Statistics • A function that summarizes values in a raster within the zones of another layer • The user specifies the “zone dataset” (e.g., geologic units) the value raster dataset (e.g., slope) • Output is a Table that summarizes zone statistics • For example, the user could find the range and mean value of slope for geologic units “The Zonal Statistics function allows the user to produce a simplified graph of the statistics. Note the check box in the dialog box.” GIS for Planetary Mappers 17
1 2 3 • 1. Set the Zone dataset (the feature that contains the region upon which statistics need to be created) • 2. Set the Value raster (the raster dataset that will be the base of the statistics) • 3. Set the statistic that is required (can be minimum, maximum, range, sum, mean, std dev, variety, majority, minority, median) GIS for Planetary Mappers
Crater Helper Tools(or the Crater/Feature tools)for ArcMap By Richard A Nava http://webgis.wr.usgs.gov/pigwad/tutorials/scripts GIS for Planetary Mappers
Add to ArcMap • After install: • Tools menu > Customize > Toolbars tab > Crater Helper checkbox GIS for Planetary Mappers 20
Crater Helper Tools Toolbar 7 Digitizing Tools 19 Modes Dockable Window GIS for Planetary Mappers 21
What for? – “Modes” • Digitizing craters and other features • Store as many attributes as possible about each feature with a few clicks: • Feature location • Diameter • Extents • Azimuth • Area • Morphology • Preservation Lat, Lon Km X-Min, Y-Max... Km2 Deg. GIS for Planetary Mappers 22
Digitizing tools 1. By Point 2. By Line 3. By Circle 4. By Polygon 5. By 3-Point Circle 6. By 6-Point Ellipse 7. By Multi-Point Line GIS for Planetary Mappers 23
Creating/Measuring Features Create/measure on map Select a mode Select a tool Lat, Lon Km Deg. Km2 GIS for Planetary Mappers 24
Mode: Create Point/Calculate Diameter Example: Extents enabled By 3 point circle tool Extents Location Rim Diameter
Set Attributes/Link Features Ejecta tab Link tab Flag tab Flag selected features as complete or incomplete Set morphology and preservation attributes Link feature polylines to points
Using the Link Tab Check “Link Features” Set Target and Source layers Set Target and Source link fields • Dynamic link • Done automatically when creating a polyline and a point after filling link tab parameters • Manual link • By selecting a polyline and point and clicking the “Link” button after filling link tab parameters 27
Example: Dynamic link polyline and point Points Lines
Toolbar Remarks • Cannot use all tools with all modes • Ex: Cannot create a polyline with the single point tool • Some modes are combinations of more basic modes • Ex: Create Polyline/Create Point/Calc. Diameter • Information is always stored in fields Because of this, several fields will be added to the point and/or polyline feature classes The ‘Enable Extent Computations’ button can be used with most tools and works as a checkbox GIS for Planetary Mappers 29
Tools for Crater Statisticsby Freie University GIS for Planetary Mappers
CraterTools CraterTools is a GIS add-on toolbar Download: http://hrscview.fu-berlin.de/software.html Publication: Kneissl T., van Gasselt S., Neukum G., Map-projection-independent crater size-frequency determination in GIS environments - New software tool for ArcGIS, Planetary and Space Science, 2010. GIS for Planetary Mappers 31
CraterTools Interface Green Flag: Create a point and polygon layer Grid: Create a grid of a certain size within an area Diameter Circle: Create a circle using 2 points 3-point Circle: Create a circle using 3 points Flag Crater: Mark craters that are of interest Scale Tool: Determine if a crater meets the minimum size Select/Unselect Areas: Exclude/include areas Preview Graph: Allows preview of plotted data Checkered Flag: Export data into CraterStats format Diameters to Centroid: Converts polygons to points 32
CraterTools Resulting count is output as a text file that includes the crater diameters and the area in km2. This file is formatted for CraterStats If you have already finished your crater counts and want to plot them using CraterStats, just add the area and diameters into this format. DOES NOT matter if the craters are organized into any particular order or bins because CraterStats is smart enough to organize and bin your data 33
CraterStats Produces uniform plots of crater statistic and fit isochrons to deposition and resurfacing Download: http://hrscview.fu-berlin.de/software.html Also need to download the IDL virtual machine – also at the location above Publication: Michael G.G., Neukum G., Planetary surface dating from crater size-frequency distribution measurements: Partial resurfacing events and statistical age uncertainty, Earth and Planetary Science Letters, 2010, DOI: 10.1016/j.epsl.2009.12.041 GIS for Planetary Mappers 34
CraterStats Interface Add Titles Scale Plot Functions Plot Types Insert Text File
break GIS for Planetary Mappers 37
Standard projections • Standard projections in planetary • Simple Cylindrical (Equidistance Cylindrical, Equirectangular) • rectangular global (decimal degrees or meters), simple “database” projection. • Sinusoidal • Used for global and many tiled data releases, equal area projection. • Mercator • Conformal, only use for equatorial areas, used in the Mars 1:5M series. • Transverse Mercator • Good for local areas “large” scale maps. A Small scale map shows more land area, but with smaller representations and, therefore, lesser detail. GIS for Planetary Mappers 38
Standard projections – cont’d • Standard projections in planetary • Polar Stereographic • Good for polar, error increases away from central latitude (usually 90 or -90). Scale should be based on polar radius, can use polar radius. • Lambert Conformal • Good for mid latitudes. Error increases away from both standard parallels. • Orthographic • Globe view, not good for mapping as the limb falls away, makes for pretty figures but you need 3 globes to portray an entire planet. ISIS uses a spherical equation • Mollweide • Coming of age projection, global GIS for Planetary Mappers 39
Standard projections – cont’d • Other projections in planetary • Lambert Azimuthal • Good for mid latitude and polar, equal area, VICAR/HRSC team uses it for polar areas. • Robinson • Good for figures (similar to Mollweide) GIS for Planetary Mappers 40
Geographic – Geocentric Issues • Planetographic vs Planetocentric - issues • Mars is basically the only problem • Most commercial commonly don’t use ocentric - ArcMap can. • Work around … use sphere definition for Mars. • For commercial applications, don’t use elliptical definitions and ocentric latitudes. Using elliptical and ographic is okay. GIS for Planetary Mappers 41
East-West Longitude • Positive East vs. Positive West • Not much to say because commercial GIS/RS systems use positive East. You should always save your files using positive East. • To use West, you either fake out the system (by using your own code) or you switch software. It is just a shift, so no errors are incurred. • Luckily, if you are working in meters there is no East/West system, only Cartesian (X,Y). GIS for Planetary Mappers 42
Setting Projections in Arc • Setting planetary bodies in ArcMap • Example for decimal degree (lat/lon) • Okay to set ”Mars 2000.prj” ellipse. (find under “Coordinate Systems\Geographic Coordinate Systems\Solar System\Mars 2000.prj”) (semi-major radius 3396190 m) GIS for Planetary Mappers 43
Setting Projections in Arc • Example for the ArcMap dataframe or for MOLA and most raster datasets on the data DVD. • To define a new projection click on New, “Projected” GIS for Planetary Mappers 44
Setting Projections in Arc • Mars Polar projection • Note the “D_Mars_2000_Sphere_Polar” definition (semi-minor radius 3376200.0 m ) GIS for Planetary Mappers 45
Setting Projections in Arc • Projecting datasets using toolbox Projecting vector Projecting raster datasets GIS for Planetary Mappers 46
Hands-on (lon/lat display and data frame projections) GIS for Planetary Mappers 47
Simple Image RegistrationUsing a GIS Worldfile GIS for Planetary Mappers 48
* Worldfile • Most simple image registration 5.0 (size of pixel in x direction) – A 0.0 (rotation term for row) - D 0.0 (rotation term for column) - B -5.0 (size of pixel in y direction) - E 492169.690 (x coordinate of center of upper left pixel in map units) - C 54523.3180 (y coordinate of center of upper left pixel in map units) - F GIS for Planetary Mappers 49
Worldfile • Algebraic Form (six parameter affine transformation) x’ = Ax + By + C y’ = Dx + Ey + F where x’ = calculated x-coordinate of the pixel on the map y’ = calculated y-coordinate of the pixel on the map x = column number of a pixel in the image y = row number of a pixel in the image A = x-scale; dimension of a pixel in map units in x direction B,D = rotation terms (assumed to be zero) C,F = translation terms; x,y map coordinates of the center of the upper-left pixel E = negative of y-scale; dimension of a pixel in map units in y direction GIS for Planetary Mappers 50