Download
1 / 1
10 likes | 135 Vues
COOLING SYSTEM OPTIMIZATION IN POLYMER INJECTION MOULDING. CÉLIO FERNANDES* Supervisor: A. Gaspar-Cunha, Co-supervisors: A. Pontes; J. Viana * cbpf@dep.uminho.pt.

E N D
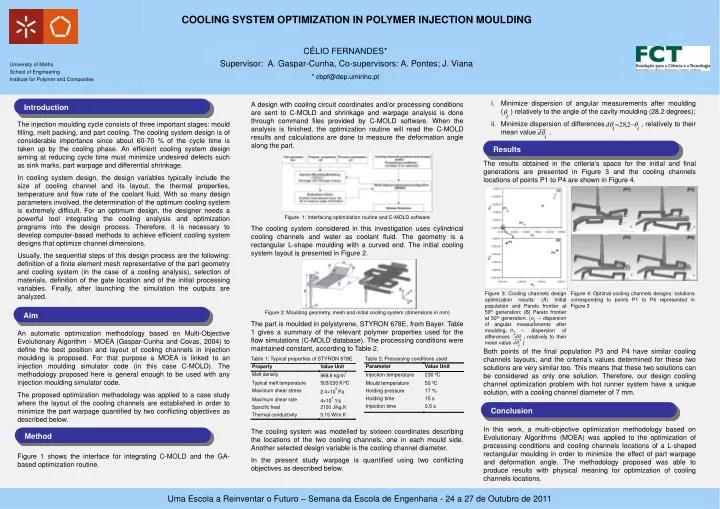
COOLING SYSTEM OPTIMIZATION IN POLYMER INJECTION MOULDING CÉLIO FERNANDES* Supervisor: A. Gaspar-Cunha, Co-supervisors: A. Pontes; J. Viana * cbpf@dep.uminho.pt The injection moulding cycle consists of three important stages: mould filling, melt packing, and part cooling. The cooling system design is of considerable importance since about 60-70 % of the cycle time is taken up by the cooling phase. An efficient cooling system design aiming at reducing cycle time must minimize undesired defects such as sink marks, part warpage and differential shrinkage. In cooling system design, the design variables typically include the size of cooling channel and its layout, the thermal properties, temperature and flow rate of the coolant fluid. With so many design parameters involved, the determination of the optimum cooling system is extremely difficult. For an optimum design, the designer needs a powerful tool integrating the cooling analysis and optimization programs into the design process. Therefore, it is necessary to develop computer-based methods to achieve efficient cooling system designs that optimize channel dimensions. Usually, the sequential steps of this design process are the following: definition of a finite element mesh representative of the part geometry and cooling system (in the case of a cooling analysis), selection of materials, definition of the gate location and of the initial processing variables. Finally, after launching the simulation the outputs are analyzed. An automatic optimization methodology based on Multi-Objective Evolutionary Algorithm - MOEA (Gaspar-Cunha and Covas, 2004) to define the best position and layout of cooling channels in injection moulding is proposed. For that purpose a MOEA is linked to an injection moulding simulator code (in this case C-MOLD). The methodology proposed here is general enough to be used with any injection moulding simulator code. The proposed optimization methodology was applied to a case study where the layout of the cooling channels are established in order to minimize the part warpage quantified by two conflicting objectives as described below. Figure 1 shows the interface for integrating C-MOLD and the GA-based optimization routine. • Minimize dispersion of angular measurements after moulding ( ) relatively to the angle of the cavity moulding (28.2 degrees); • Minimize dispersion of differences , relatively to their mean value . • The results obtained in the criteria’s space for the initial and final generations are presented in Figure 3 and the cooling channels locations of points P1 to P4 are shown in Figure 4. • Both points of the final population P3 and P4 have similar cooling channels layouts, and the criteria’s values determined for these two solutions are very similar too. This means that these two solutions can be considered as only one solution. Therefore, our design cooling channel optimization problem with hot runner system have a unique solution, with a cooling channel diameter of 7 mm. • In this work, a multi-objective optimization methodology based on Evolutionary Algorithms (MOEA) was applied to the optimization of processing conditions and cooling channels locations of a L-shaped rectangular moulding in order to minimize the effect of part warpage and deformation angle. The methodology proposed was able to produce results with physical meaning for optimization of cooling channels locations. Introduction A design with cooling circuit coordinates and/or processing conditions are sent to C-MOLD and shrinkage and warpage analysis is done through command files provided by C-MOLD software. When the analysis is finished, the optimization routine will read the C-MOLD results and calculations are done to measure the deformation angle along the part. Figure 1: Interfacing optimization routine and C-MOLD software The cooling system considered in this investigation uses cylindrical cooling channels and water as coolant fluid. The geometry is a rectangular L-shape moulding with a curved end. The initial cooling system layout is presented in Figure 2. Figure 2: Moulding geometry, mesh and initial cooling system (dimensions in mm) The part is moulded in polystyrene, STYRON 678E, from Bayer. Table 1 gives a summary of the relevant polymer properties used for the flow simulations (C-MOLD database). The processing conditions were maintained constant, according to Table 2. Table 1: Typical properties of STYRON 678E Table 2: Processing conditions used The cooling system was modelled by sixteen coordinates describing the locations of the two cooling channels, one in each mould side. Another selected design variable is the cooling channel diameter. In the present study warpage is quantified using two conflicting objectives as described below. Results Figure 3: Cooling channels design optimization results: (A) Initial population and Pareto frontier at 50th generation; (B) Pareto frontier at 50th generation. ( – dispersion of angular measurements after moulding, – dispersion of differences , relatively to their mean value ) Figure 4: Optimal cooling channels designs: solutions corresponding to points P1 to P4 represented in Figure 3 Aim Conclusion Method