Download
1 / 49
750 likes | 3.11k Vues
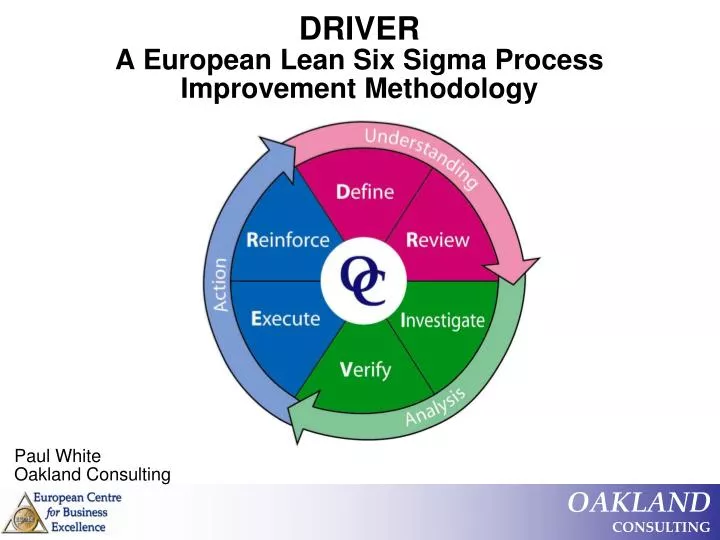
DRIVER A European Lean Six Sigma Process Improvement Methodology. Paul White Oakland Consulting. Agenda. Oakland Consulting Process Improvement Methodologies Lean Principles Six Sigma Overview DRIVER: Process Focus Deployment Strategy European Aeronautical Defence Sector (EADS)

E N D
DRIVERA European Lean Six Sigma Process Improvement Methodology Paul White Oakland Consulting
Agenda • Oakland Consulting • Process Improvement Methodologies • Lean Principles • Six Sigma Overview • DRIVER: • Process Focus • Deployment Strategy • European Aeronautical Defence Sector (EADS) • EADS DRIVER Case Study • Questions & Answers
Workshop Discussion • What methods can we use to protect the customer?
Workshop Discussion 100% Inspection – Does it work?
Will 100% inspection protect the customer? Scenario Oakland’s Marketing Department are very proud of the publications they produce. The customers of Oakland expect the highest quality publications. Therefore, the manager of the publications department has decided to employ you as an inspector at the end of the printing process to ensure that the text produced is accurate. You have 30 seconds to inspect the following set of text and count how many times the letter ‘F’ appears, (upper & lower case) including the title.
F-Test Finished files are the results of many years of sceintific studies combined with the experience of many years of effort
F-Test How many did you see? Have another look!
F-Test Finished files are the results of many years of sceintific studies combined with the experience of many years of effort
F-Test Did anyone change their mind?
F-Test Finished files are the results of many years ofsceintific studies combined with the experience of many years of effort
F-Test Did you spot anything else?
F-Test F-Test Finished files are the results of many years of sceintific studies combined with the experience of many years of effort
Workshop Discussion 100% Inspection – Does it work?
Process ImprovementMethodology Objective • Waste Elimination / Defect Reduction • Efficiency / Yield Improvement • Improved Customer Satisfaction • Higher Shareholder Value
What now? What focus? • Review • Project revision • Standardisation • Share learnings • Further improvement • Project goals/measures • Set up team • Map process • Measure process • Identify key problems • Find root causes • Identify solution • Plan for implementation Act Plan • Measurement • Assessment • Analysis Check • Prepare for implementation • Training • Communication • Implement improvement • Change management • Project management Do What happened? What action? Plan, Do, Check, Act
0. Emergency Response Action 1. Identify the team • Build cross-functional team • Protect the customer • Where, when, etc. • Is/Is not analysis • Process map • Measure and set objective 2. Define the problem • Short-term solution • Rescue affected customers 3. Contain the symptom • Use FMEA, Five Whys • Identify and check root cause 4. Identify root causes • Focus on fixing root causes • Set targets and owners for implementation 5. Choose corrective action • Implement to plan • Collect data to prove success 6. Implement corrective action • Documentation • Revise targets, FMEAs, etc. 7. Make change permanent • Recognise individuals and the team • Celebrate success 8. Recognise the team Global 8D
Define Measure Analyse Improve Control DMAIC • Identify champion and owner • Initial assessment of situation • Define scope and goals of project • Map process • Validate measurement system • Calculate process capability • Analyse for sources of variation • Identify potential root causes • Verify actual root cause • Develop solution • Create new process map • Cost / benefit analysis • Standardise • Sustain the gain • Develop control strategy
Measure Analyse Improve Control Methodology Comparison PDCA 8D DMAIC DRIVER 1. Identify team Define 2. Define problem Define 3. Contain symptom Review Plan Investigar 4. Identify root causes Verbessern Do 5. Choose corrective action Check 6. Implement corrective action Execute 7. Make change permanent Act 8. Recognise the team Renforcer
DRIVERA holistic approach • DRIVER training also includes ‘project management’ & ‘change management’
Lean Principles • Lean principles are based on the Toyota Production System (TPS) • TPS was developed after benchmarking the Ford Motor Company River Rouge plant in Detroit in the 1950’s. • The key characteristics of TPS / Lean are: • Only producing what is required, when it is required • Close links throughout the supply chain – just in time • Producing right first time • A lean mindset & company culture • The elimination of non-value added activity (waste)
Remove Waste, don’t Improve the Value-Add Total Throughput Time Value-add time Non-Value Add + Other time = + Usual Focus Work longer-harder-faster, add people, complexity or equipment Lean Eliminate Waste to Improve the Value Stream World Class Companies: ‘NVA’ = 80% TTT Typical ‘NVA’ = 99% TTT 26
Over-production Defects (Scrap/Rework) Inventory Motion Over-processing Waiting Transportation The 7 wastes 1 7 2 WASTE 6 3 5 4
A Lean Example LEAN Concepts • Standardised Work • Waste Elimination • Parallel Processing • Cell Layout • Batch Reduction • Quick Changeover • Line Balancing • Other Concepts • Visual Management • 5 S • Error Proofing
Workshop Discussion • Are Lean principles only applicable to manufacturing processes?
What is Six Sigma? • Six Sigma is focused on improving the quality of our products and services • How do we define the term ‘quality’? • The generic definition of quality is ‘meeting or exceeding the customer requirements’ • The customer of a process can be internal or external • Therefore, Six Sigma improves quality, thus, improving customer satisfaction
LSL USL Defects Defects Acceptable Customer Requirement Process Performance Six SigmaSatisfying the Customer Sigma is a capability metric that compares process performance against customer requirements
Is 99% Quality Good Enough? 3.8 Sigma 99% Good 6 Sigma 99.99966% Good 1 short or long landing every 5 years 2 short or long landings at an airport per day (200 daily flights) • Unsafe drinking water for almost 15 minutes each day Unsafe drinking water one minute every seven months 1.7 incorrect operations per week • 5,000 incorrect surgical operations per week (500,000 operations per week) 10,700 defects per million opportunities 3.4 defects per million opportunities
Quantifying Process Capability } Sigma is a universal measure of process performance
Can this distribution from a process output fit between the specification limits of 5 1? ± 3 3 4 4 5 5 6 6 7 7 Variable Process Capability Analysis Variable process capabilityis the ability of a process outputto ‘fit’ between the specification limits which are defined by the customer requirements.
Variable Process Capability Analysis Capability is an assessment of: process spread as a ratio of the process tolerance. – Cp / Pp LSL USL Tolerance Process spread Cpk / Ppk isthe location of the process mean with respect to both process specification limits. LSL USL Mean
Workshop Exercise Cp LSL USL 1 Cp = 3 Cp = 2 Cp = Cp = 0.5 Cp = 1
X X X X X Workshop Exercise Cpk LSLUSL Cpkl = 1 Cpku = 1 Cpku= 1 Cpkl = 5 Cpkl = 1 Cpku = 3 Cpkl = 0.5 Cpku= 0.5 Cpkl = 3 Cpku = -1
Cp / Cpk Simulation The London Institute of Education utilised digital technology to create a Cp / Cpk training tool to enhance learning in the workplace. Cp Cpk http://www.lkl.ac.uk/research/technomaths/tools/spctools/
DRIVERThe Process Focus Define: Grasp the problem & identify objectives Y: Output Review: Map ‘as-is’ process & current performance 40–60 x’s: Inputs Investigar: Analysis & root cause identification 3-5 x’s Verbessern: Solution generation & prioritisation 3-5 x’s Execute: Implement solutions to ‘sustain the gain’ 3-5 x’s Renforcer: Share best practice & lessons learnt Optimised Process
DRIVER Deployment Structure Inverting the hierarchal triangle Customers of Products and Services Green Belts Black Belts Project Champions Master Black Belts Executive Black Belts • DRIVER deployment is led by executives to ensure company wide support
DRIVER Project Checklist Project Title: Project Leader: ......................................................... Project Sponsor: ....................................................... Process Owner: ........................................................ Team Members: ....................................................... Start Date: ................................................................ • Key: • Completed • In progress • X Not required R&R Roles and responsibilities KOMY Key Ouput Metric Y CTQ Critical to Quality SOP Standard Operating Procedures SLA Service Level Agreement • Monitor progress • Share lessons learnt (organisation memory, newsletters etc) • Thank the team • Celebrate success • Plan future activities • Project sponsor approval • Develop problem statement • Identify project scope • Determine SMART objective • Formulate project team with R&Rs • SIPOC map • Define CTQs • Stakeholder map • Develop comm-unication plan • Develop outline project plan • Refine & sign-off Project Charter • Project sponsor approval • ‘Current state’ process map • Identify potential quick wins • Identify measurements to be taken • Develop data collection plan • Collect data • Calculate baseline process capability (KOMY) • Revisit problem statement • Project sponsor approval • Analyse Waste – Lean Toolkit • Analyse Variation – Six Sigma toolkit • Team brainstorm to identify root causes • Document root causes on Cause & Effect diagram • Select top 3-5 root causes • Validate root causes • Project sponsor approval • Team brainstorm solutions • Select optimum solutions • Conduct pilot study (or FMEA) • Verify improvements • ‘Future state’ process map • Review stakeholder map and comms plan • Implementation business case (cost / benefit) • Implementation timing plan • Project sponsor approval • Implement actions on timing plan • Select control techniques (SPC) • Update or create SOP / SLA • Develop control metrics (KPI’s) • Disengage old process • Monitor progress • Validate improvements: process capability (compare against baseline Y) • Handover to process owner • Project sponsor approval End Date: End Date: End Date: End Date: End Date: End Date: © Oakland Consulting Plc. All rights reserved.
European Aeronautical Defence Sector (EADS) Eurocopter Military Transport Airbus Astrium Defence & Security
MTAD - Improve super plastic forming process EF-2000 slats Context • Situation : Deviations in slat spar position cause scraps and repairs at assembly leading to non quality costs and manufacturing lead-time increase. • Performance : • On-quality 27% spar position values. 8.5% scrap. • 132.000 € non quality costs EF-2000 Slat Superplastic forming process What has been done Achievements • D – Stake-holder analysis, DoE training, Pareto analysis for scoping. • R – Process map & key parameters, run charts, histograms. • I – Run charts, Process capability analysis, Scatter plot. • V – Variance & correlation analysis, Pareto, Rules determination. • ER – SPC, KPI monitoring
Performance User Help Desk Process Improvement Context Situation : Information Management integration at company level with numerous local processes Performance : On time Incident Resolution performance fluctuated a great deal from process to process What has been done Achievements • DProcesses identification, Prioritisation, Voice of Customer, Voice of Business • RProcess mapping, waste identification • I Statistical analysis (process capability, Pareto), root cause • V Solution generation, waste reduction, external benchmark, business case • E Responsibility charting, implementation • RFull deployment proposal • Buy-in facilitated by the DRIVER method • Performance increased by 40% (increase of calls closed by UHD) • Cost base sustainable benefit exceeding 400 K€ per year for Germany and France
Summary • Oakland Consulting • Process Improvement Methodologies • Lean Principles • Six Sigma Overview • DRIVER: • Process Focus • Deployment Strategy • European Aeronautical Defence Sector (EADS) • EADS DRIVER Case Study • Questions & Answers
Questions and Answers Paul White Oakland Consulting