Download
1 / 24
480 likes | 2.62k Vues
Basic Principles of Raman spectroscopy and its applications for semiconductor characterization . Kiril Kirilov Faculty of Physics, Sofia University, 5. blvd. J.Bourchier, 1164 Sofia,Bulgaria. the Raman effect. predicted by Adolf Smekal in 1923

E N D
Basic Principles of Raman spectroscopy and its applications for semiconductor characterization Kiril Kirilov Faculty of Physics, Sofia University, 5. blvd. J.Bourchier, 1164 Sofia,Bulgaria
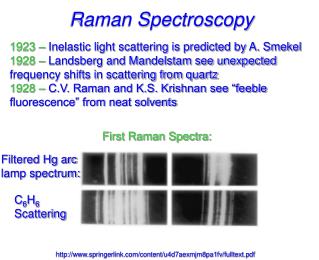
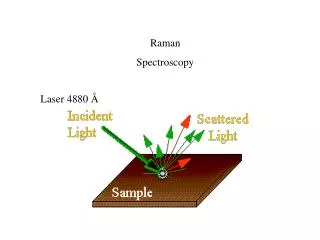
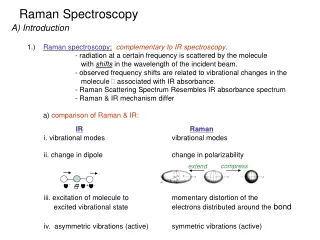
the Raman effect • predicted by Adolf Smekal in 1923 • named after one of its discoverers in 1928, the Indian scientist Sir Chandrasekhara Venkata Raman • Raman scattering is the inelastic scattering of a photon – change in photon energy • By nature weak effect (approximately 1 in 107 photons) Sir C. V. Raman
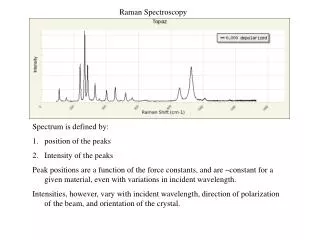
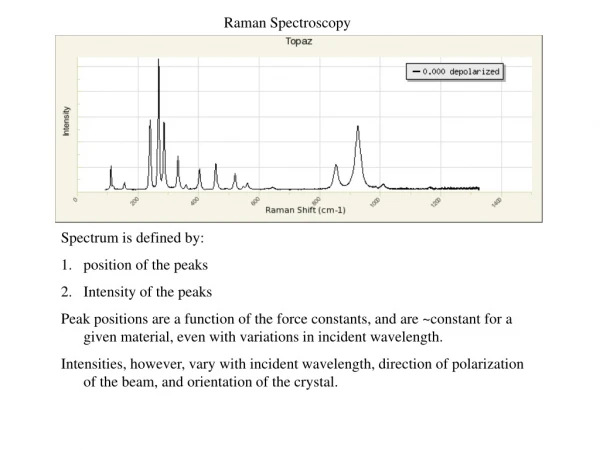
Light intensity Schematic Raman spectrum • Rayleigh line – elastic scattering • Raman Stokes line – scattered photon give up energy • Raman Anti-stokes line – scattered photon gain energy
Schematic diagram of the process Schematic diagram of the Raman scattering processThe vertical direction represents energy
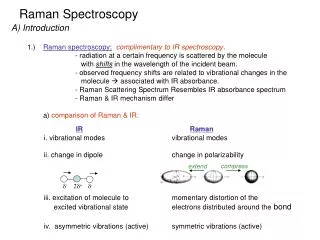
Classical Theory • The electric field Ei of the light wave acts on the charges in the material • Interaction of light with a single molecule considered • Induced dipole moment Pi of a molecule (vector) (1) • pi – induced permanent dipole momentij– polarizability (tensor)i, j, k, l – subscripts running over directions x, y, z Hyper Raman effect Raman effect
Classical Theory • Both pi and ij may change if the molecule vibrates • Then pi and ij may be expanded as Taylor series(2)qn – generalized co-ordinates of normal modes • Assuming small atomic displacements qn, we can approximate the time dependence(3)n ,L – frequency of displac-ement and electric field • These expressions can be substituted into a linear version of (1) …
IR absorption Rayleigh scattering Ramanscattering (Stokes & anti-Stokes) Classical Theory
Sample Geometry “Brewster” Setup Back Scattering Forward Scattering Right-angle Scattering non-transparent sample transparent sample
Porto notation • Convention of representing experimental scattering geometries • Example: x(zx)y • excitation light incident on the sample along x axis,polarized along z direction • scattered light was detected along y axis,polarized along x direction • Useful notation if the axes are defined with respect to the crystal axes of symmetry,then x…z relate to Raman tensor components
In solid state physics spontaneous Raman spectroscopy is used to among other things, characterize materials: • measure temperature. • find the crystallographic orientation of a sample. • Determine Crystal stress: through E2h mode • Determine carrier concentration: through A1(LO) mode and LPP- • can be used to observe other low frequency excitations of the solid, such as plasmons, magnons, and superconducting gap excitations. • Obtain information on the population of a given phonon mode in the ratio between the Stokes intensity and anti-Stokes intensity. • In nanotechnology, a Raman microscope can be used to analyze nanowires to better understand the composition of the structures.
Crystal tension • Commonly employed for the analysis of the pressure dependence of phonon modes is quadratic relationship • ω0, ω’, ω” fitting parameters
Crystal temperature • Non-invasively temperature monitoring (T=10-1275K) during growth, processing, high power electronic devices • It is used simple empirical relation to describe temperature dependence of the phonon frequencies • Simple but accurate • Unfortunately the parameters from fitting can’t be related to properties of the material • More complex theoretical modeling provides this connection (Cui [96]) • ω0, A, B – fitting parameters • Diamond, GaN[Liu], AlN • E2(high) for AlGaN
Raman setups at our faculty • Micro-Raman, LabRam HR spectrometer , 20 mW polarized vertically HeNe laser, spot size of about 1 μm • Two switcheable gratings • Scanning range: 1800gr range:0-950 nm ,600gr range:0-2850 nm • Accuracy: In the range between 450 nm and 850 nm, the wavenumber accuracy is ± 1 cm-1 with 1800 l/mm grating • Objectives – x10, x20, x50, x100 • Peltier cooled CCD1024x256 • (T=-70oC)
Doping and Plasmon-phonon coupled modes Наблюдаването на L+ и L- модовете може да се използва за определяне на концентрацията на свободните носители.
Confocal microscopy • very high spatial resolution: the lateral and depth resolutions were 250 nm and 1.7 µm, respectively, using a confocal Raman microspectrometer with the 632.8 nm line from a He-Ne laser with a pinhole of 100 µm diameter • much higher resulting photon flux than achieved in conventional Raman setups. • benefit of enhanced fluorescence quenching. • high photon flux can also cause sample degradation, and for this reason some setups require a thermally conducting substrate. • Water does not generally interfere with Raman spectral analysis.
Surface enhanced Ramanspectroscopy (SERS) • a surface sensitive technique that results in the enhancement of Raman scattering by moleculesadsorbed on rough metal surfaces. • The enhancement factor can be as much as 1014-1015, which allows the technique to be sensitive enough to detect single molecules.[1](Wikipedia)
Resonance Raman spectroscopy • The excitation wavelength is matched to an electronic transition of the molecule or crystal, so that vibrational modes associated with the excited electronic state are greatly enhanced. • This is useful for studying large molecules such as polypeptides, which might show hundreds of bands in "conventional" Raman spectra. It is also useful for associating normal modes with their observed frequency shifts.[10]
Other Raman techniques • Hyper Raman - A non-linear effect in which the vibrational modes interact with the second harmonic of the excitation beam. This requires very high power, but allows the observation of vibrational modes which are normally "silent". It frequently relies on SERS-type enhancement to boost the sensitivity.[11] • Spontaneous Raman Spectroscopy - Used to study the temperature dependence of the Raman spectra of molecules. • Optical Tweezers Raman Spectroscopy (OTRS) - Used to study individual particles, and even biochemical processes in single cells trapped by optical tweezers. • Spatially Offset Raman Spectroscopy (SORS) - The Raman scatter is collected from regions laterally offset away from the excitation laser spot, leading to significantly lower contributions from the surface layer than with traditional Raman spectroscopy.[12]This technique allows highly accurate chemical analysis of objects beneath obscuring surfaces, such as tissue, coatings and bottles. Examples of uses include analysis of: bone beneath skin,[2] tablets inside plastic bottles,[3] explosives inside containers[4] and counterfeit tablets inside blister packs. • Tip-Enhanced Raman Spectroscopy (TERS) - Uses a silver or gold tip to enhance the Raman signals of molecules situated in its vicinity. The spatial resolution is approximately the size of the tip apex (20-30 nm). TERS has been shown to have sensitivity down to the single molecule level.