Download
1 / 21
230 likes | 391 Vues
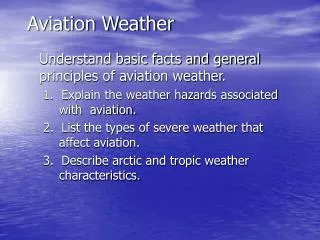
Introduction to AWWD (Aviation Winter Weather Dashboard). AWWD Changes for 2012-2013. Addition of diversionary airports assigned to each Core airport Forecast trending information Enhanced filtering capabilities 24-hour snowfall forecast. Overview.

E N D
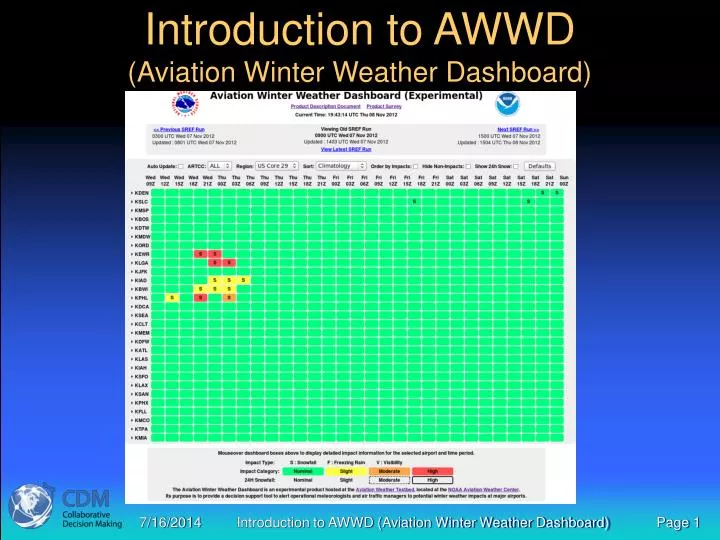
Introduction to AWWD (Aviation Winter Weather Dashboard)
AWWD Changes for 2012-2013 • Addition of diversionary airports assigned to each Core airport • Forecast trending information • Enhanced filtering capabilities • 24-hour snowfall forecast
Overview • The experimental Aviation Winter Weather Dashboard (AWWD) displays the potential winter weather impact to the Core 30 airports (-HNL) and their respective top diversionary airports • AWWD is updated 4 times a day • Shows potential operational impact to each airport through a matrix of color coded boxes. • Projects out to 87 hours in three hour increments. • The information is calculated using Short-Range Ensemble Forecast (SREF) numerical weather prediction system.
Purpose • The purpose of AWWD is to provide a decision support tool for Air Traffic Managers (FAA/Industry) to coordinate long range strategic winter weather planning by providing guidance on the impact from winter weather at major airports and their diversion airports.
Primary Use • AWWD’s primary use is for SPT, but should also be used by airport authorities and other aviation stakeholders for common situational awareness of potential impact on terminal operations.
AWWD Display • The dashboard will flag airports with 20% to 40% or greater probability of weather which will potentially impact terminal operations.
AWWD Display • AWWD renders the potential impact to each airport, at three-hourly forecast intervals, using data from the SREF. • The probability of accumulated snowfall, freezing rain, and visibility are used to determine the particular impact category assigned to each airport, every three forecast hours.
AWWD Display • The grid will display the color coded boxes based on how the winter weather event will potentially impact the operation for that airport. • For example, .1 to 1.9 inches of snow in a 3 hour time frame would reflect a “green” box for DEN but for MIA .1 to 1.9 inches of snow in a 3 hour time frame would translate to a “red” box. Airport Terminal Groups Airports are organized by annual snowfall and frequency of winter weather.
Terminal Groups Group I +30 Inches Forecast terminals grouped by annual snowfall The airports are split into four separate groups ranked according to annual snowfall climatology. Group II 15-30 Inches Group III 0.1 – 15 Inches Group IV Trace
Diversion Airports • Click on the arrow next to the airport of interest to view forecasted weather conditions at the potential diversionary airports • Note, the diversion airports for each core airport were determined base on an analysis of the most common diversion airports for each airport
AWWD Legend • Letters in the box indicate either a type of precipitation or that visibility may be restricted that exceeds 20% to 40% probability of occurrence during that 3 hour time block. • The letters are limited to: • S = Snow F = Freezing Rain V = Visibility • If no letters are present, probability of wintery weather (snow, freezing rain, or visibility) is less than 20% to 40%.
AWWD Legend • AWWD Forecasts potential impact • Types of impact include Deicing delays, terminal constraints, Diversions, Runway/Taxiway snow removal, etc.,. • Green (Nominal Impact) • Winter weather (snow, freezing rain, or visibility) could take place, but it should have minimal, or limited impact on the operation. • Yellow (Slight Impact) • Orange (Moderate Impact) • Red (High Impact)
AWWD Mouse Over • Mousing over the box will display additional information: • Triggering criteria and forecast totals for winter weather impact • Trend information showing previous three model runs and associated forecast for 3-hour time frame
Time Stamp Information Bar • Provides: • Current time and date • Time Stamps: • Current SREF Run: • Time/Date of model run • Time/Date of the latest AWWD update. • Next SREF Run: • Time/Date of next SREF update • Previous SREF Run: • Access to and time/date of previous AWWD images. • AWWD will be updated at approximately 02Z, 08Z, 14Z and 20Z,
Filtering the AWWD • Order by impacts • Assigns the airports with the most impact to the top • Hide Non-Impacts • Removes airports with no impact • Show 24h Snow • Displays forecasted 24 hour total accumulation • Enables user to sort data according to preference, Options are: • Climatology • Alphabetical • East To West • West To East • North To South • South To North Additional filter allowing user to sort based on geographical region of interest or ARTCC boundaries
AWWD Miscellaneous: • Colors on AWWD color grid are adjusted for color blindness. • Be Aware: • In the near term (24-30 hours) this information should be supplemented by other forecast resources.
Summary • The purpose of AWWD is to provide a decision support tool for Air Traffic Managers (FAA/Industry) to coordinate long range strategic winter weather planning by providing guidance on the impact from winter weather at major airports. • Primary use is for SPT but should also be used by airport authorities and other aviation stakeholders for common situational awareness of potential impact on terminal operations. • Types of operational impacts would include Deicing delays, terminal constraints, Diversions, Runway/Taxiway snow removal, etc.,. • AWWD shows potential operational impact to each airport through a matrix of color coded boxes. • Green (Nominal Impact) • Snow could take place, but it should have minimal, or limited impact on the operation. • Yellow (Slight Impact) • Orange (Moderate Impact) • Red (High Impact)
AWWD Feedback • In order to make enhancements to this tool to fit the needs of the air traffic community, Weather Evaluation Team needs feedback regarding the usability and utility of the AWWD. Please provide feedback to the following personnel: • Contacts • Kevin Johnston (540) 422-4510 (Kevin.L.Johnston@faa.gov) • Tom Lloyd (718) 709-3260 (Thomas.Lloyd@jetblue.com) • Jarrod Lichty (540) 422-4534 (Lichty@avmet.com) • Pat Murphy (816) 584-7239 (michael.pat.murphy@noaa.gov)
Introduction to AWWD (Aviation Winter Weather Dashboard)